Open Access
Fig. D.2
Download original image
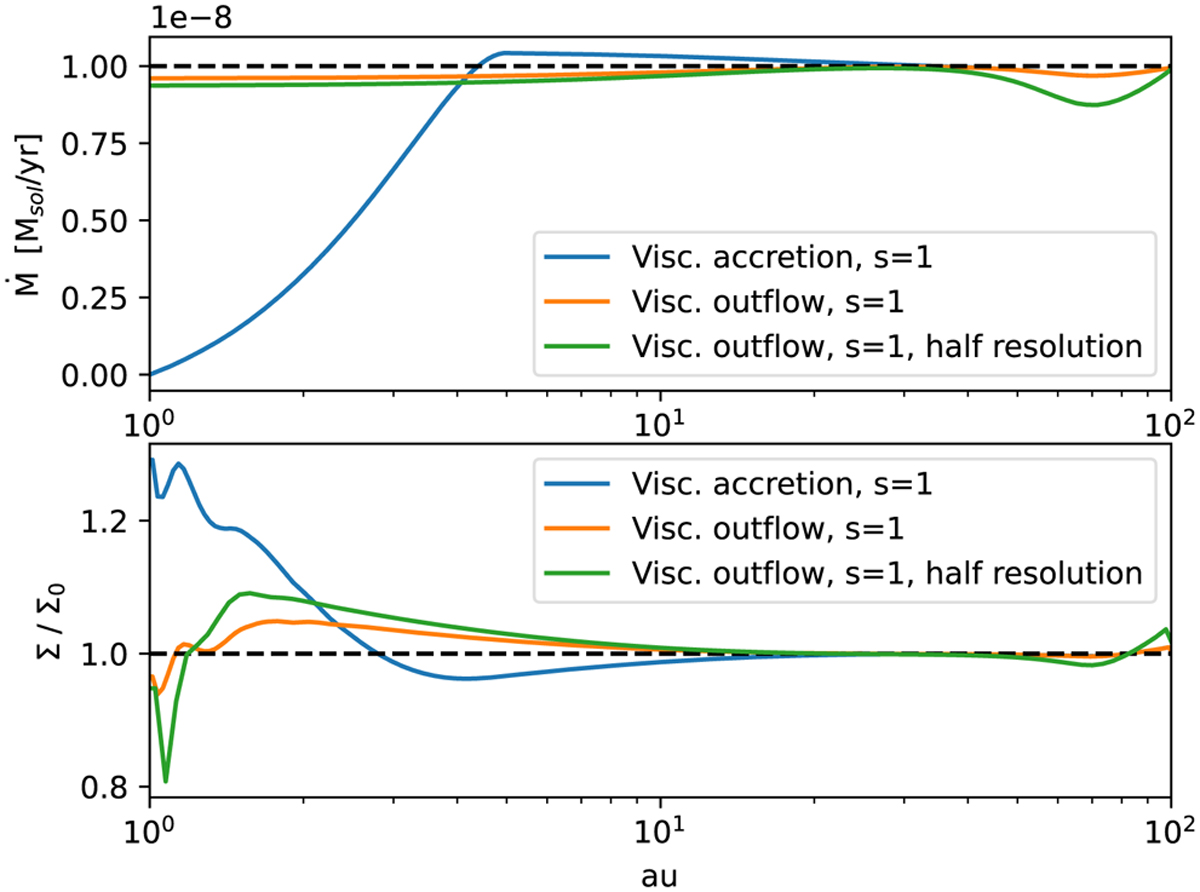
Viscous accretion through and at the inner boundary for different resolutions and methods. The panels are analogous to Fig. D.1. The dip in mass flow rate for the blue line in the inner region is due to the method removing mass from the domain and thus disturbing the equilibrium state.
Current usage metrics show cumulative count of Article Views (full-text article views including HTML views, PDF and ePub downloads, according to the available data) and Abstracts Views on Vision4Press platform.
Data correspond to usage on the plateform after 2015. The current usage metrics is available 48-96 hours after online publication and is updated daily on week days.
Initial download of the metrics may take a while.