Fig. 4
Download original image
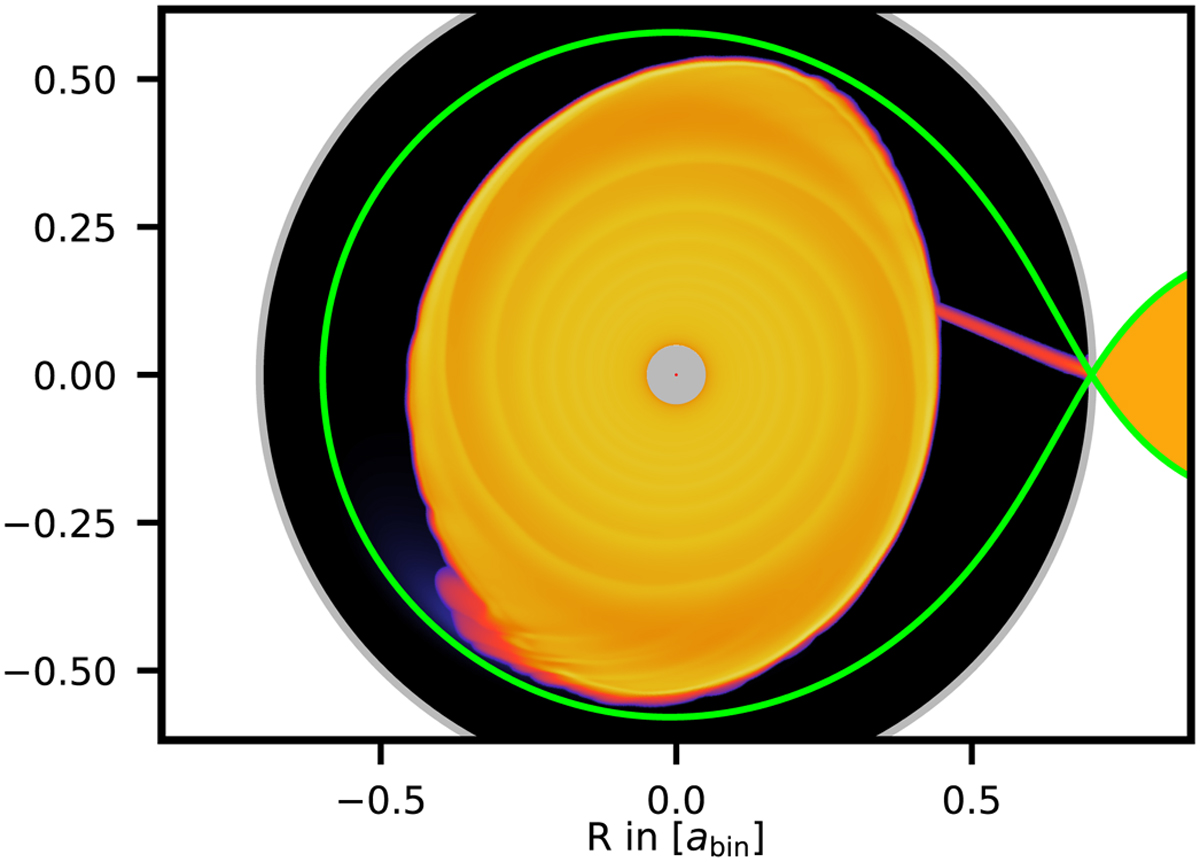
Logarithmic density plot of a simulation with the “Roche lobe overflow” boundary condition showing the stream of material emerging from the L1 point. The green line indicates the Roche lobe of the binary system and the grey circle is the outer boundary of the simulation domain. Outside the small region around the Lagrangian L1 point the boundary condition is set to “outflow”.
Current usage metrics show cumulative count of Article Views (full-text article views including HTML views, PDF and ePub downloads, according to the available data) and Abstracts Views on Vision4Press platform.
Data correspond to usage on the plateform after 2015. The current usage metrics is available 48-96 hours after online publication and is updated daily on week days.
Initial download of the metrics may take a while.