Fig. D.8
Download original image
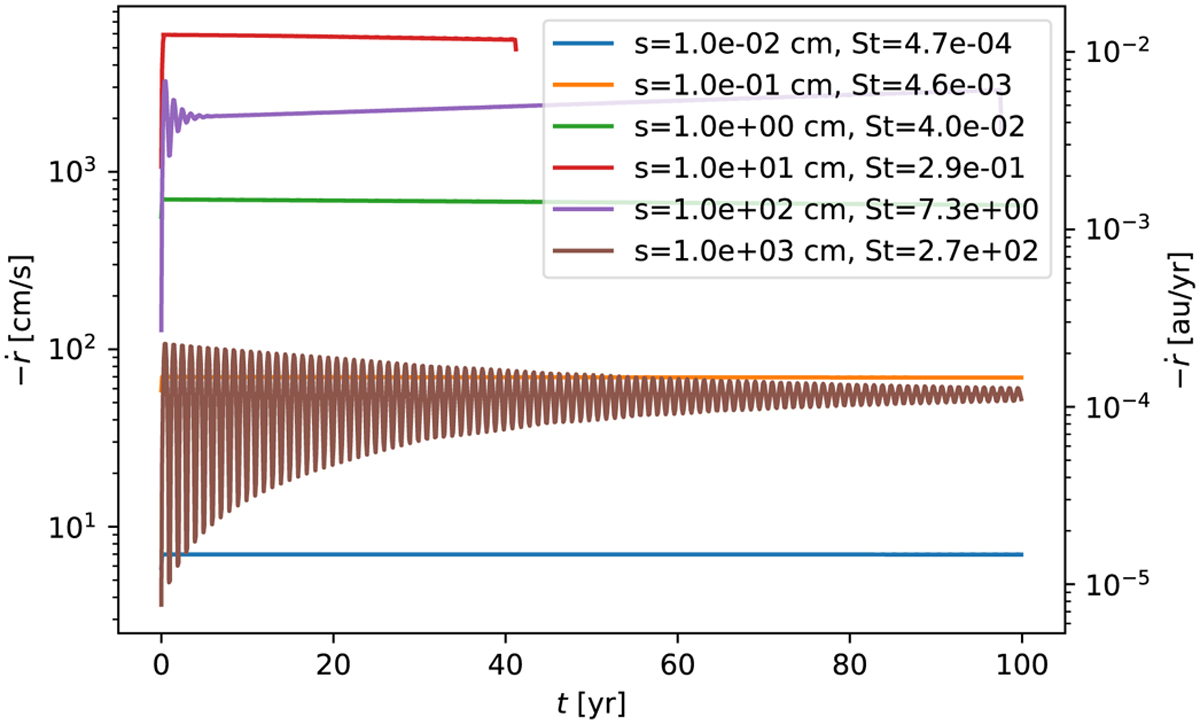
Selected dust particle trajectories from the dust drift test. The panel shows the drift velocity as a function of time with the particle size and Stokes number encoded by color. The black lines show the expected value from Eq. (D.7). For larger dust particles with Stokes equal or greater than unity, oscillations occur due to the integration method. The particles represented by the red and purple lines leave the domain at the inner boundary during the simulation.
Current usage metrics show cumulative count of Article Views (full-text article views including HTML views, PDF and ePub downloads, according to the available data) and Abstracts Views on Vision4Press platform.
Data correspond to usage on the plateform after 2015. The current usage metrics is available 48-96 hours after online publication and is updated daily on week days.
Initial download of the metrics may take a while.