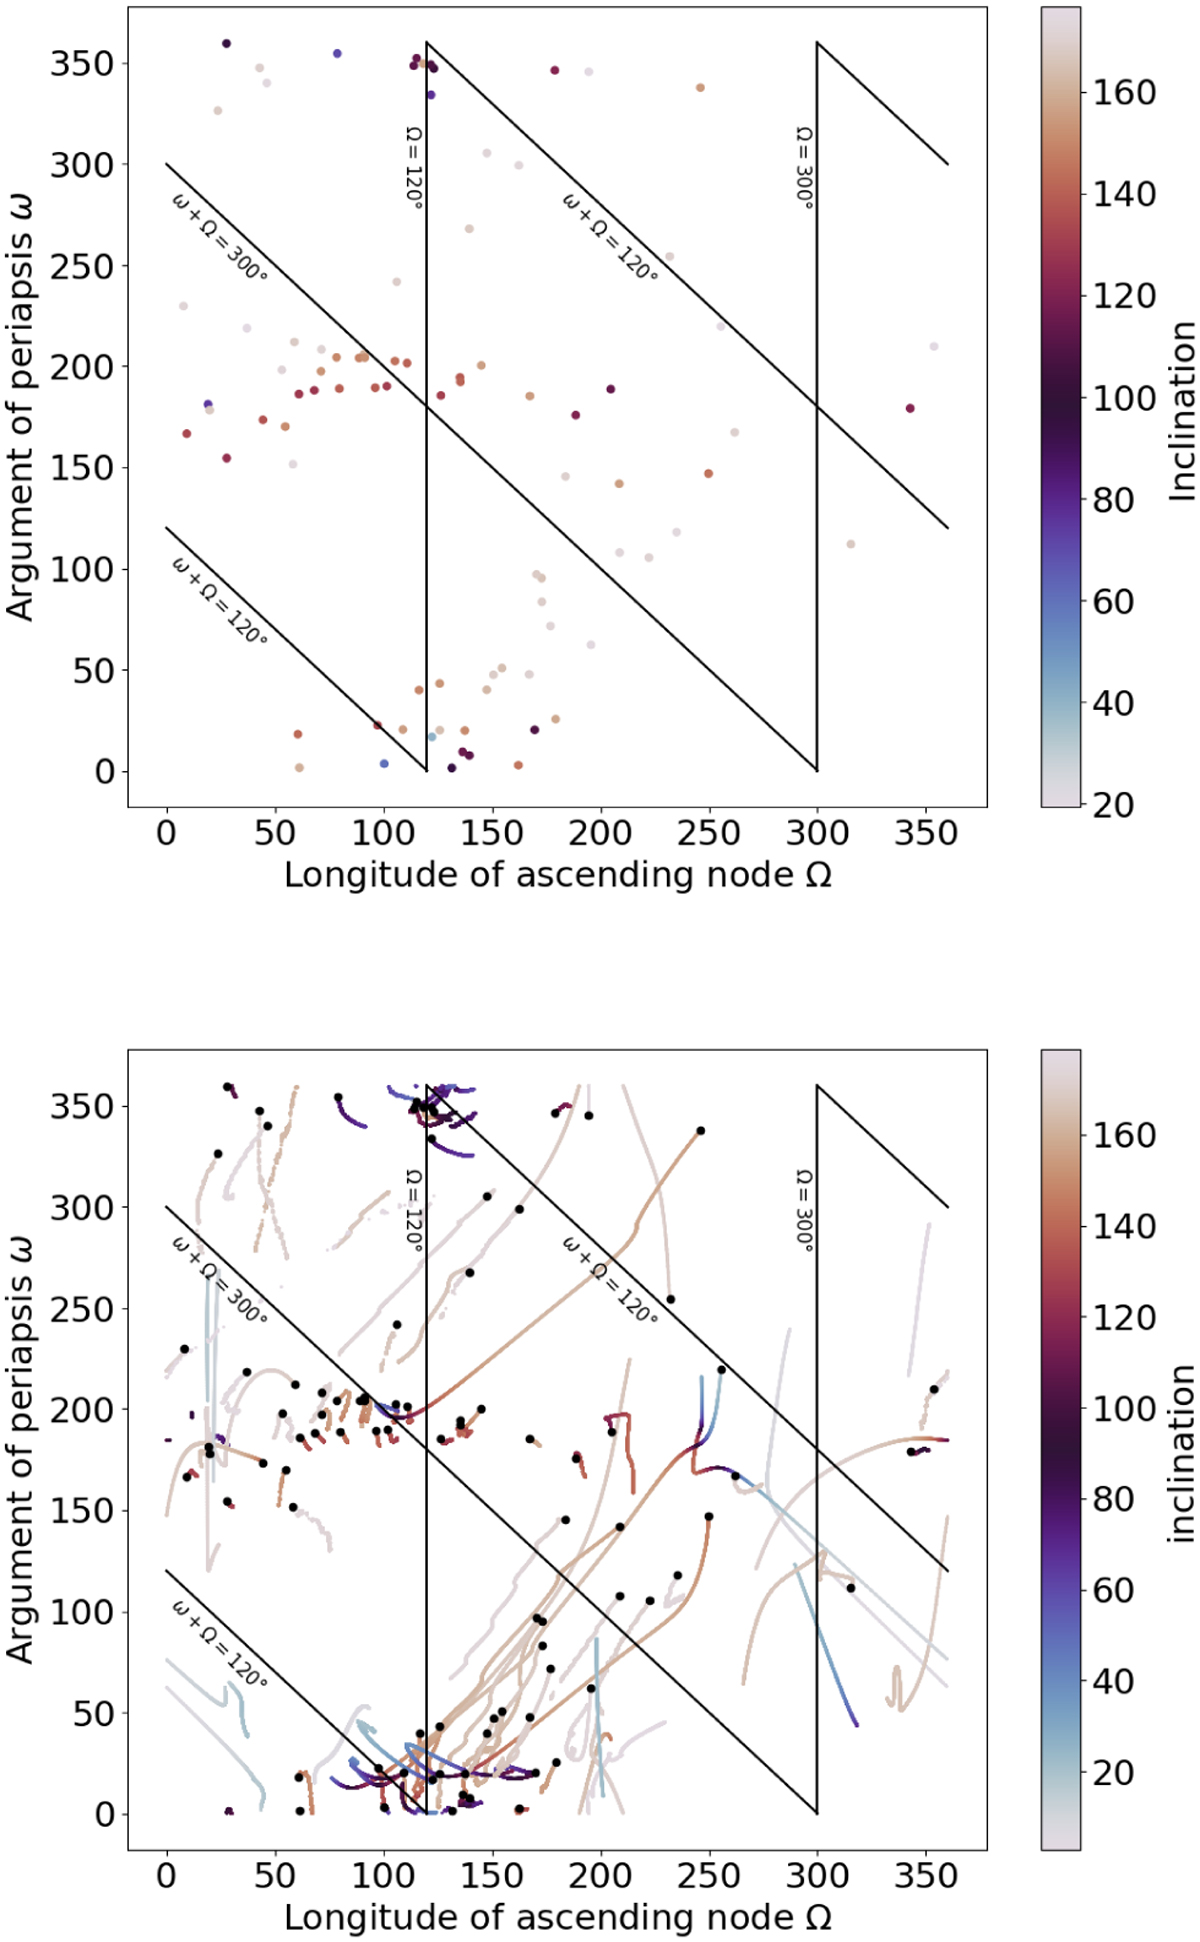
Fig. 8
Download original image
Final distribution (top) and evolution during last 365 days of simulation (bottom) of angular osculating elements: longitude of ascending node, argument of periapsis, and inclination (as colour). In the bottom figure, all objects present in the last 365 days are plotted, and those present at the end are marked by a black dot at the end of their track.
Current usage metrics show cumulative count of Article Views (full-text article views including HTML views, PDF and ePub downloads, according to the available data) and Abstracts Views on Vision4Press platform.
Data correspond to usage on the plateform after 2015. The current usage metrics is available 48-96 hours after online publication and is updated daily on week days.
Initial download of the metrics may take a while.