Fig. 3
Download original image
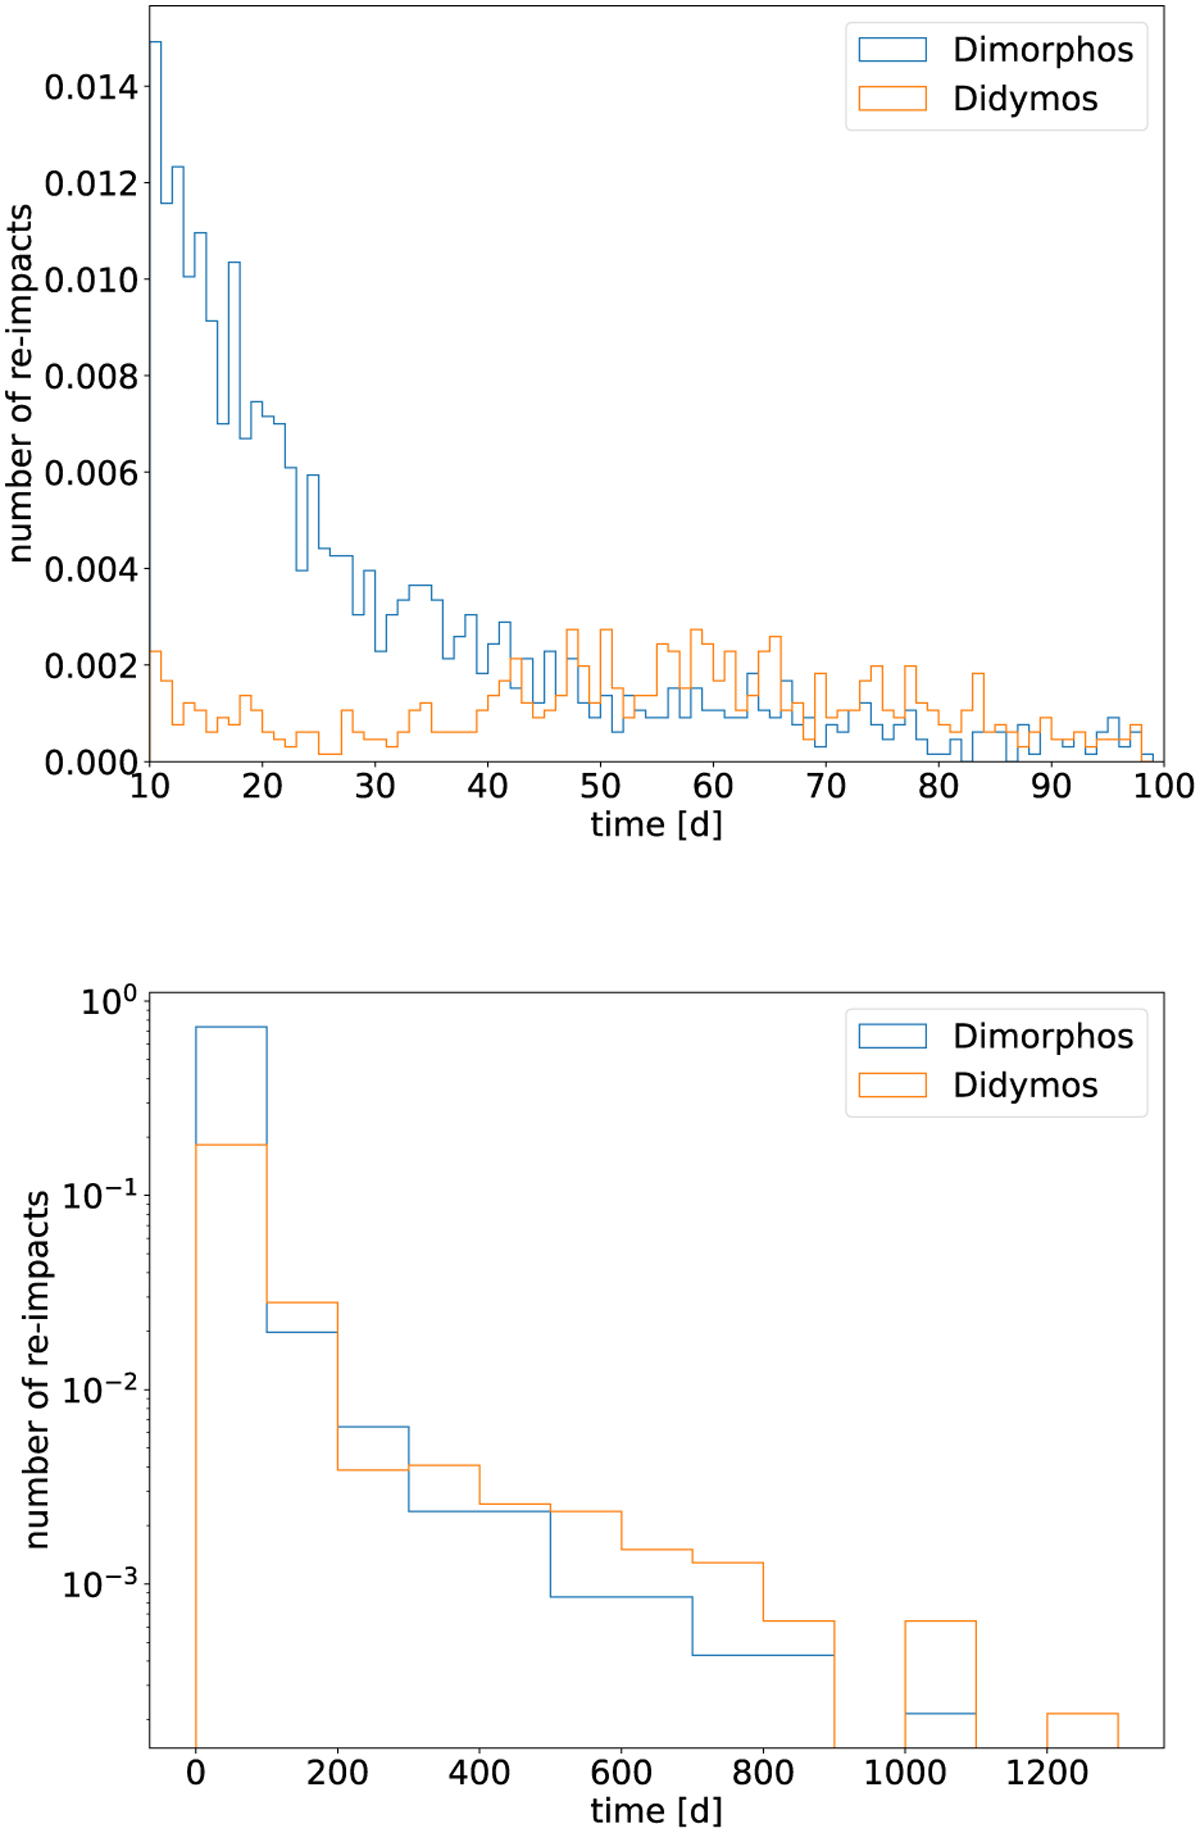
Distribution of the re-impact events over time. Bottom panel: total number of re-impact events in the whole simulation time span (logarithmic scale on the y-axis). Top panel: details of period from 10 to 100 days after the DART impact, using a linear scale on the y-axis. The blue line shows the number of re-impacts with Dimorphos, while the orange line represents the re-impacts with Didymos. Both plots are normalised such that 1 is the total number of re-impacts on both asteroids.
Current usage metrics show cumulative count of Article Views (full-text article views including HTML views, PDF and ePub downloads, according to the available data) and Abstracts Views on Vision4Press platform.
Data correspond to usage on the plateform after 2015. The current usage metrics is available 48-96 hours after online publication and is updated daily on week days.
Initial download of the metrics may take a while.