Open Access
Fig. 2
Download original image
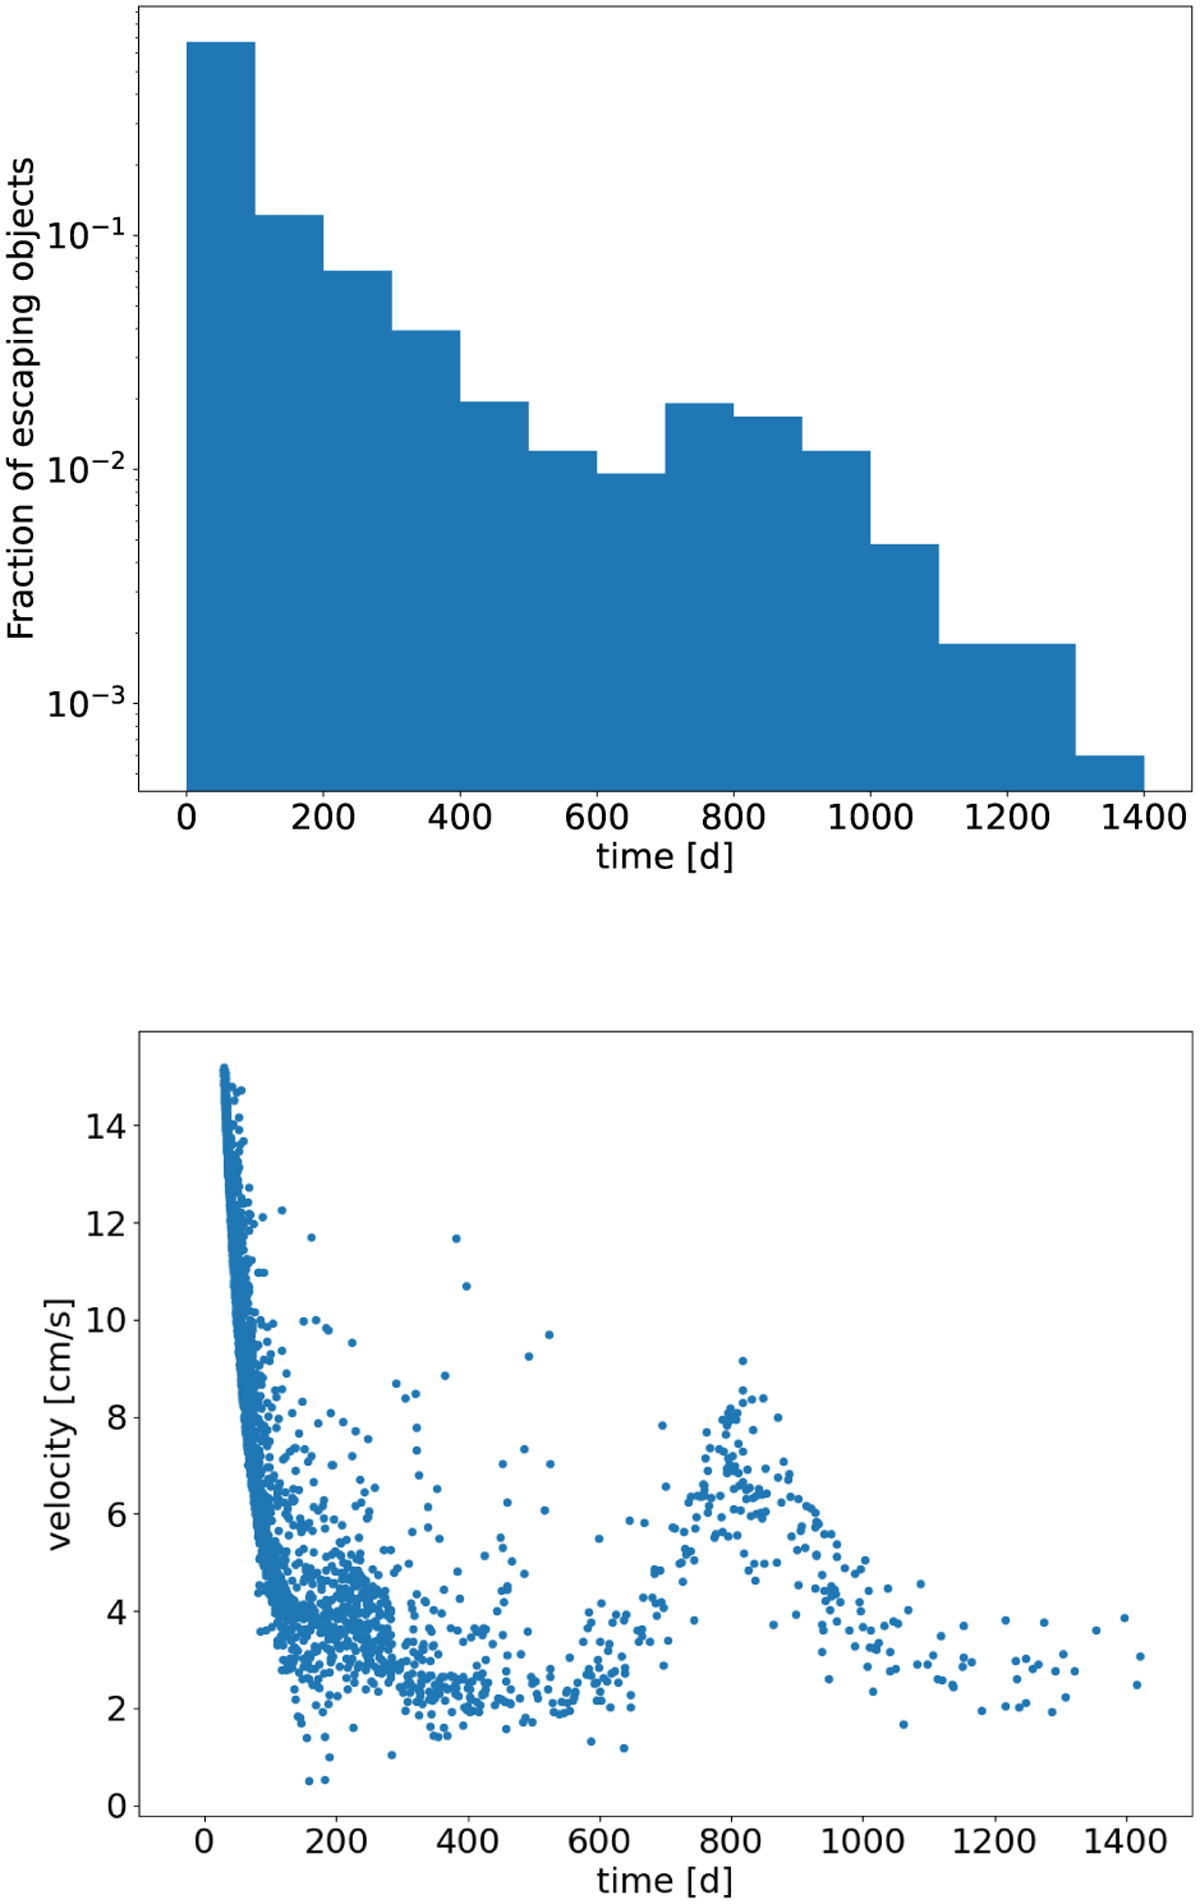
Objects escaping from Didymos system. The top plot shows the total number of escaping boulders in the simulation (normalised, where 1 is the total number of escapes). In the bottom plot, each point represents a single boulder showing its escape time and velocity relative to the Didymos barycenter at the escape time.
Current usage metrics show cumulative count of Article Views (full-text article views including HTML views, PDF and ePub downloads, according to the available data) and Abstracts Views on Vision4Press platform.
Data correspond to usage on the plateform after 2015. The current usage metrics is available 48-96 hours after online publication and is updated daily on week days.
Initial download of the metrics may take a while.