Fig. 3.
Download original image
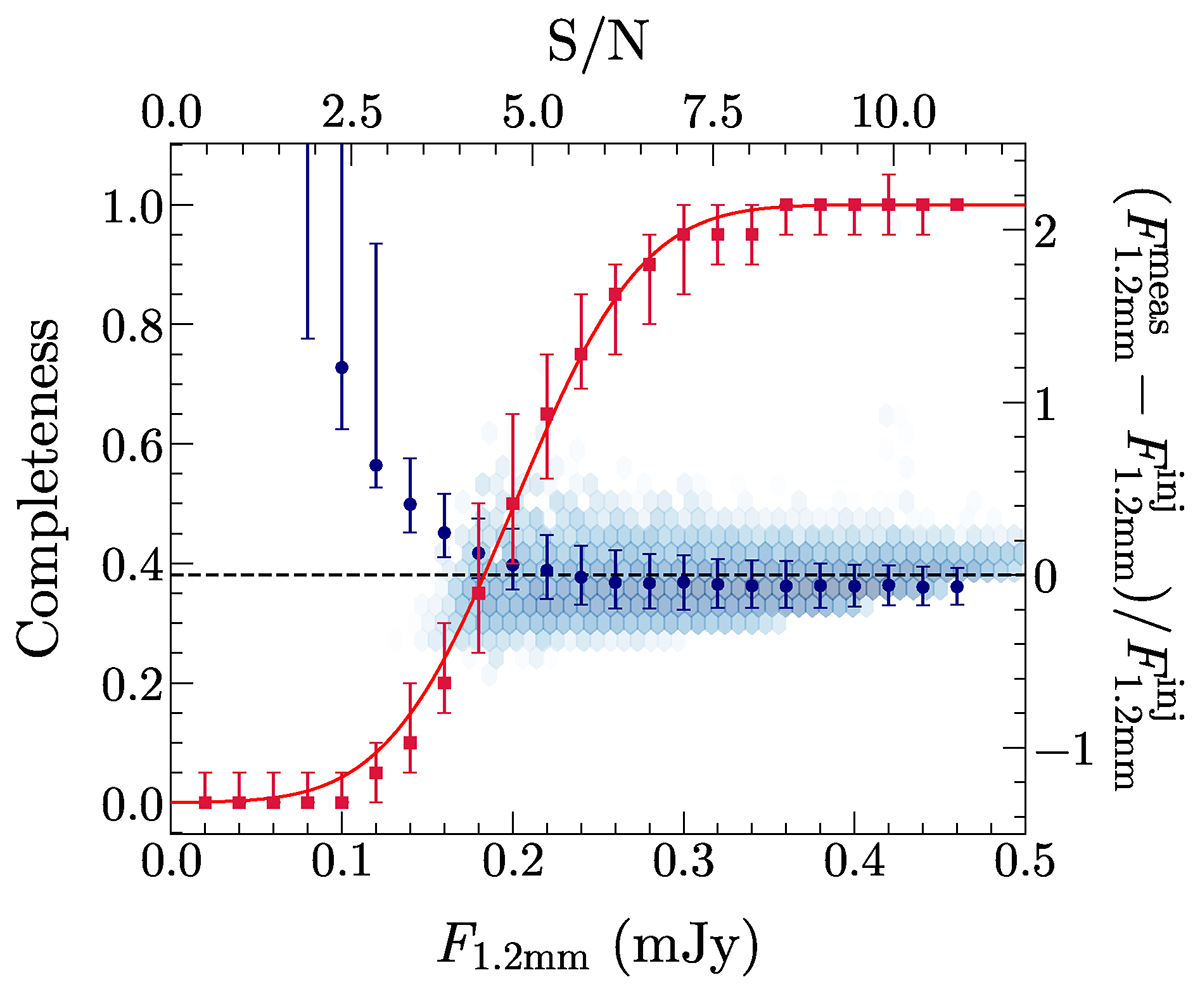
Completeness (red squares, left axis) and flux boosting (blue circles and density plot, right axis) corrected for the PB response as a function of 1.2 mm flux density (bottom axis) and S/N (top axis) of injected sources in the ALMA band 6 continuum image. The error bars are derived by computing the 16th and 84th percentile of the distributions of completeness and flux boosting measurements in each flux bin. The solid red line is the best-fitting function to the completeness values modeled as C(F1.2 mm) = {1 + erf[(F1.2 mm − A)/B]}/2 with A = 0.197 ± 0.004 and B = 0.083 ± 0.007. The density plot shows the values of the flux boosting as a function of the measured flux of the injected sources.
Current usage metrics show cumulative count of Article Views (full-text article views including HTML views, PDF and ePub downloads, according to the available data) and Abstracts Views on Vision4Press platform.
Data correspond to usage on the plateform after 2015. The current usage metrics is available 48-96 hours after online publication and is updated daily on week days.
Initial download of the metrics may take a while.