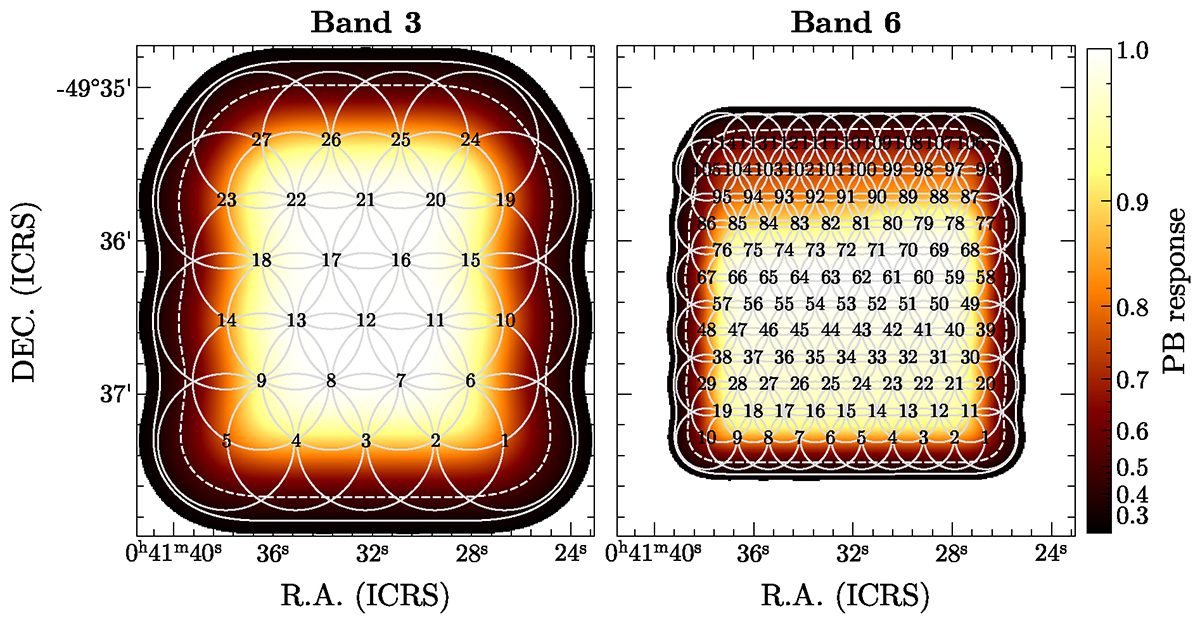
Fig. 1.
Download original image
Combined PB response for our ALMA mosaics at the representative frequency of 109.0 GHz (band 3, left panel) and for the aggregate continuum mosaic image of ALMA band 6 (right panel). The white contours correspond to a PB response of 30% (solid line) and 50% (dashed line). The circles show the disposition of the pointings with diameter equal to the HPBW of the ALMA 12 m antennas at the reference frequency of the setup.
Current usage metrics show cumulative count of Article Views (full-text article views including HTML views, PDF and ePub downloads, according to the available data) and Abstracts Views on Vision4Press platform.
Data correspond to usage on the plateform after 2015. The current usage metrics is available 48-96 hours after online publication and is updated daily on week days.
Initial download of the metrics may take a while.