Open Access
Fig. 7.
Download original image
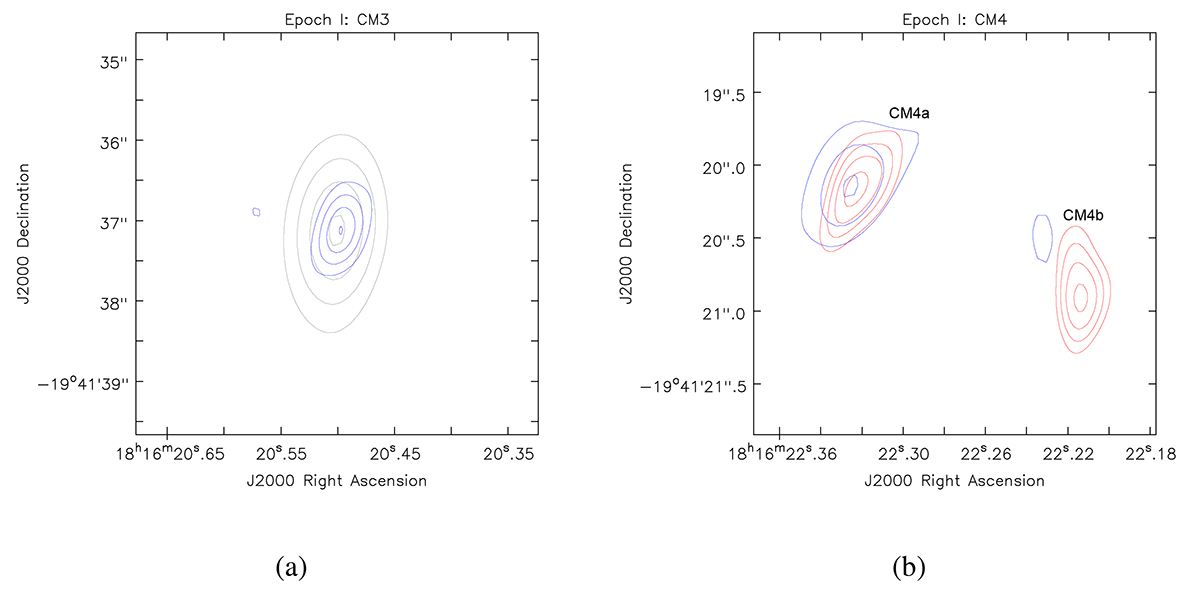
Full uv-range continuum images of CM3 (a) and CM4 (b) obtained at Epoch I (non-detection at Epoch II for both sources). Levels are [0.3, 0.5, 0.7, 0.9, 1.1] × 0.1 mJy. Grey contours represent the C band, blue the Ku band, and red the K band. See Table 1 for the synthesised beam sizes.
Current usage metrics show cumulative count of Article Views (full-text article views including HTML views, PDF and ePub downloads, according to the available data) and Abstracts Views on Vision4Press platform.
Data correspond to usage on the plateform after 2015. The current usage metrics is available 48-96 hours after online publication and is updated daily on week days.
Initial download of the metrics may take a while.