Fig. 5.
Download original image
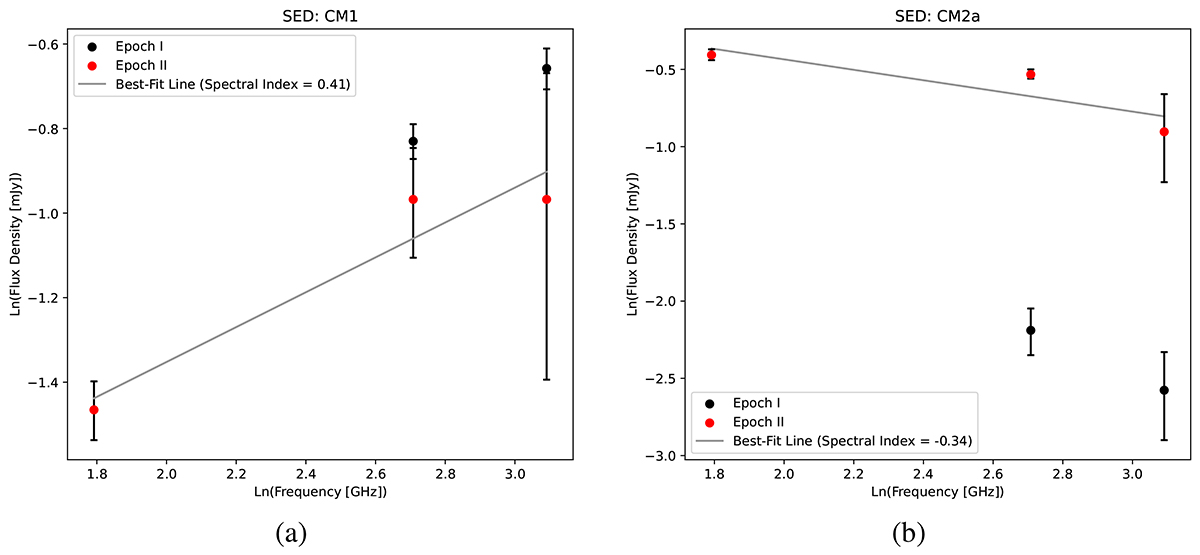
Flux density–frequency dependence for the centimetre-continuum sources CM1 (a) and CM2a (b). The filled circles with error bars represent the normalised integrated flux densities with errors from Table 3 (black for Epoch I and red for Epoch II). The presented flux density values were obtained using the uv range of 1–313 kλ (for details, see the text of Sect. 2).
Current usage metrics show cumulative count of Article Views (full-text article views including HTML views, PDF and ePub downloads, according to the available data) and Abstracts Views on Vision4Press platform.
Data correspond to usage on the plateform after 2015. The current usage metrics is available 48-96 hours after online publication and is updated daily on week days.
Initial download of the metrics may take a while.