Open Access
Fig. 10.
Download original image
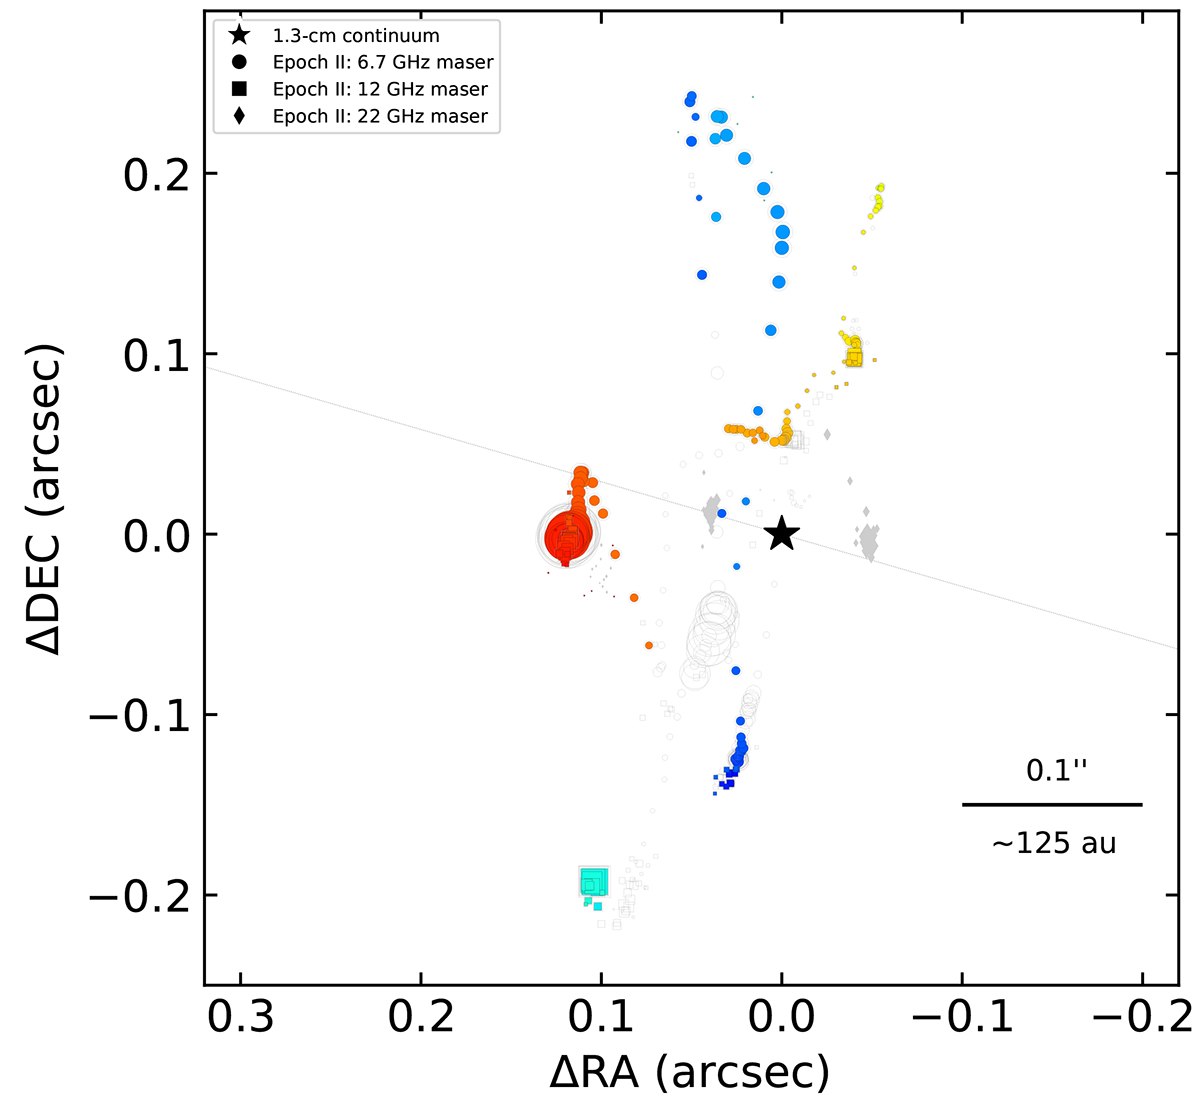
CM1 6.7 GHz methanol maser spots that showed increased fluxes during Epoch II (coloured by velocity) compared to Epoch I. The dotted grey line indicates the orientation of the large-scale outflow identified by the H2 knots in De Buizer (2003).
Current usage metrics show cumulative count of Article Views (full-text article views including HTML views, PDF and ePub downloads, according to the available data) and Abstracts Views on Vision4Press platform.
Data correspond to usage on the plateform after 2015. The current usage metrics is available 48-96 hours after online publication and is updated daily on week days.
Initial download of the metrics may take a while.