Fig. 1.
Download original image
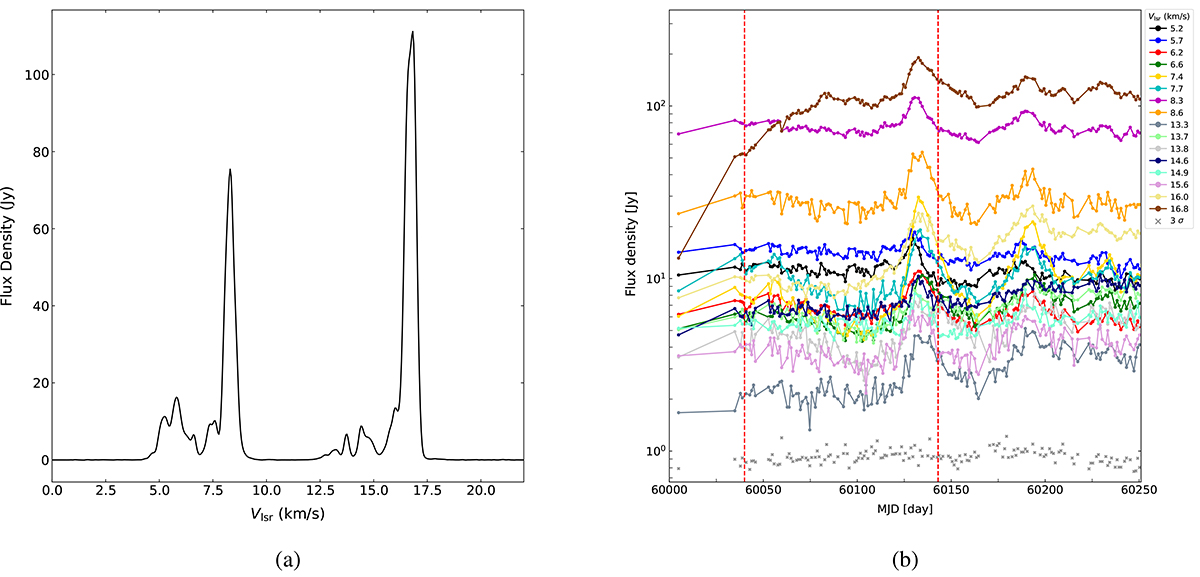
Single-dish iMet monitoring data for the 6.7 GHz methanol maser in G11.497-1.485. (a) Averaged spectrum for MJD=60000-60250. (b) Light curve of the current maser flare. The flux density scale is logarithmic. The first noted flare took place on May 20, 2023 (60084 MJD); the maximum of the flare was detected on July 7, 2023 (60132 MJD). Two dotted red lines indicate the dates of the presented VLA observations (April 6 and July 18, 2023).
Current usage metrics show cumulative count of Article Views (full-text article views including HTML views, PDF and ePub downloads, according to the available data) and Abstracts Views on Vision4Press platform.
Data correspond to usage on the plateform after 2015. The current usage metrics is available 48-96 hours after online publication and is updated daily on week days.
Initial download of the metrics may take a while.