Fig. 4
Download original image
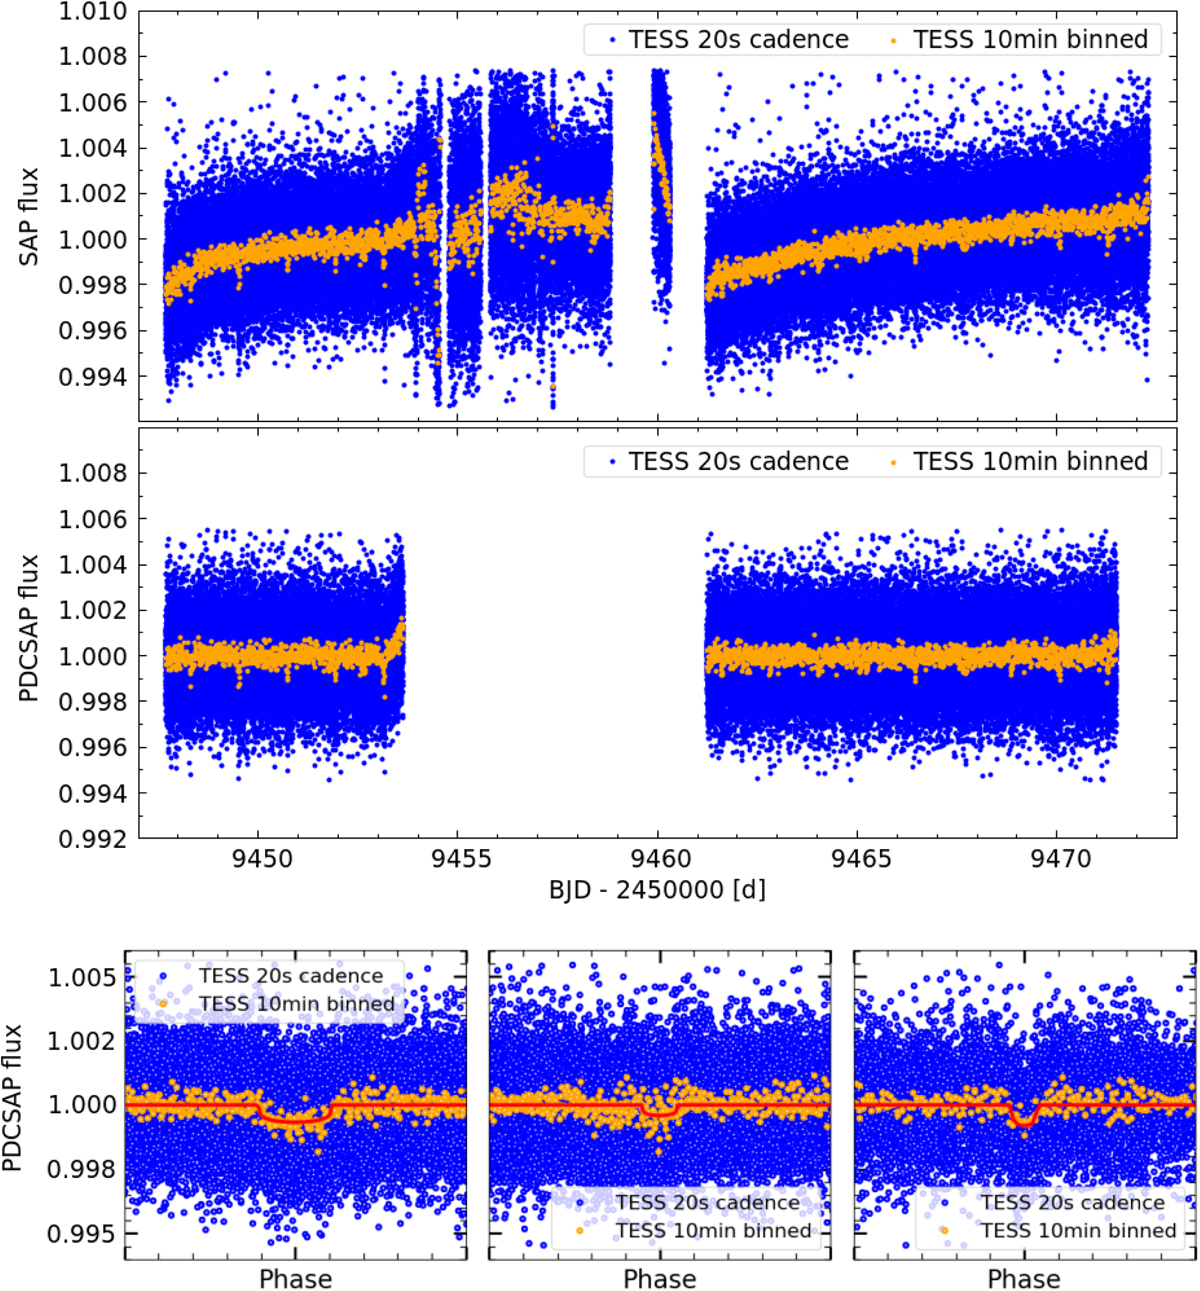
TESS light curve SAP (top panel) and PDCSAP flux (middle panel) with original cadence (blue) and binned to 10 minutes (orange). The bottom panel shows phase folds according to planetary periods and mid-transit times derived by Rodriguez et al. (2018) for planet b (left), planet c (middle), and planet d (right). The red line presents a transit model based on parameters from Rodriguez et al. (2018) for illustrative purpose.
Current usage metrics show cumulative count of Article Views (full-text article views including HTML views, PDF and ePub downloads, according to the available data) and Abstracts Views on Vision4Press platform.
Data correspond to usage on the plateform after 2015. The current usage metrics is available 48-96 hours after online publication and is updated daily on week days.
Initial download of the metrics may take a while.