Open Access
Fig. 14
Download original image
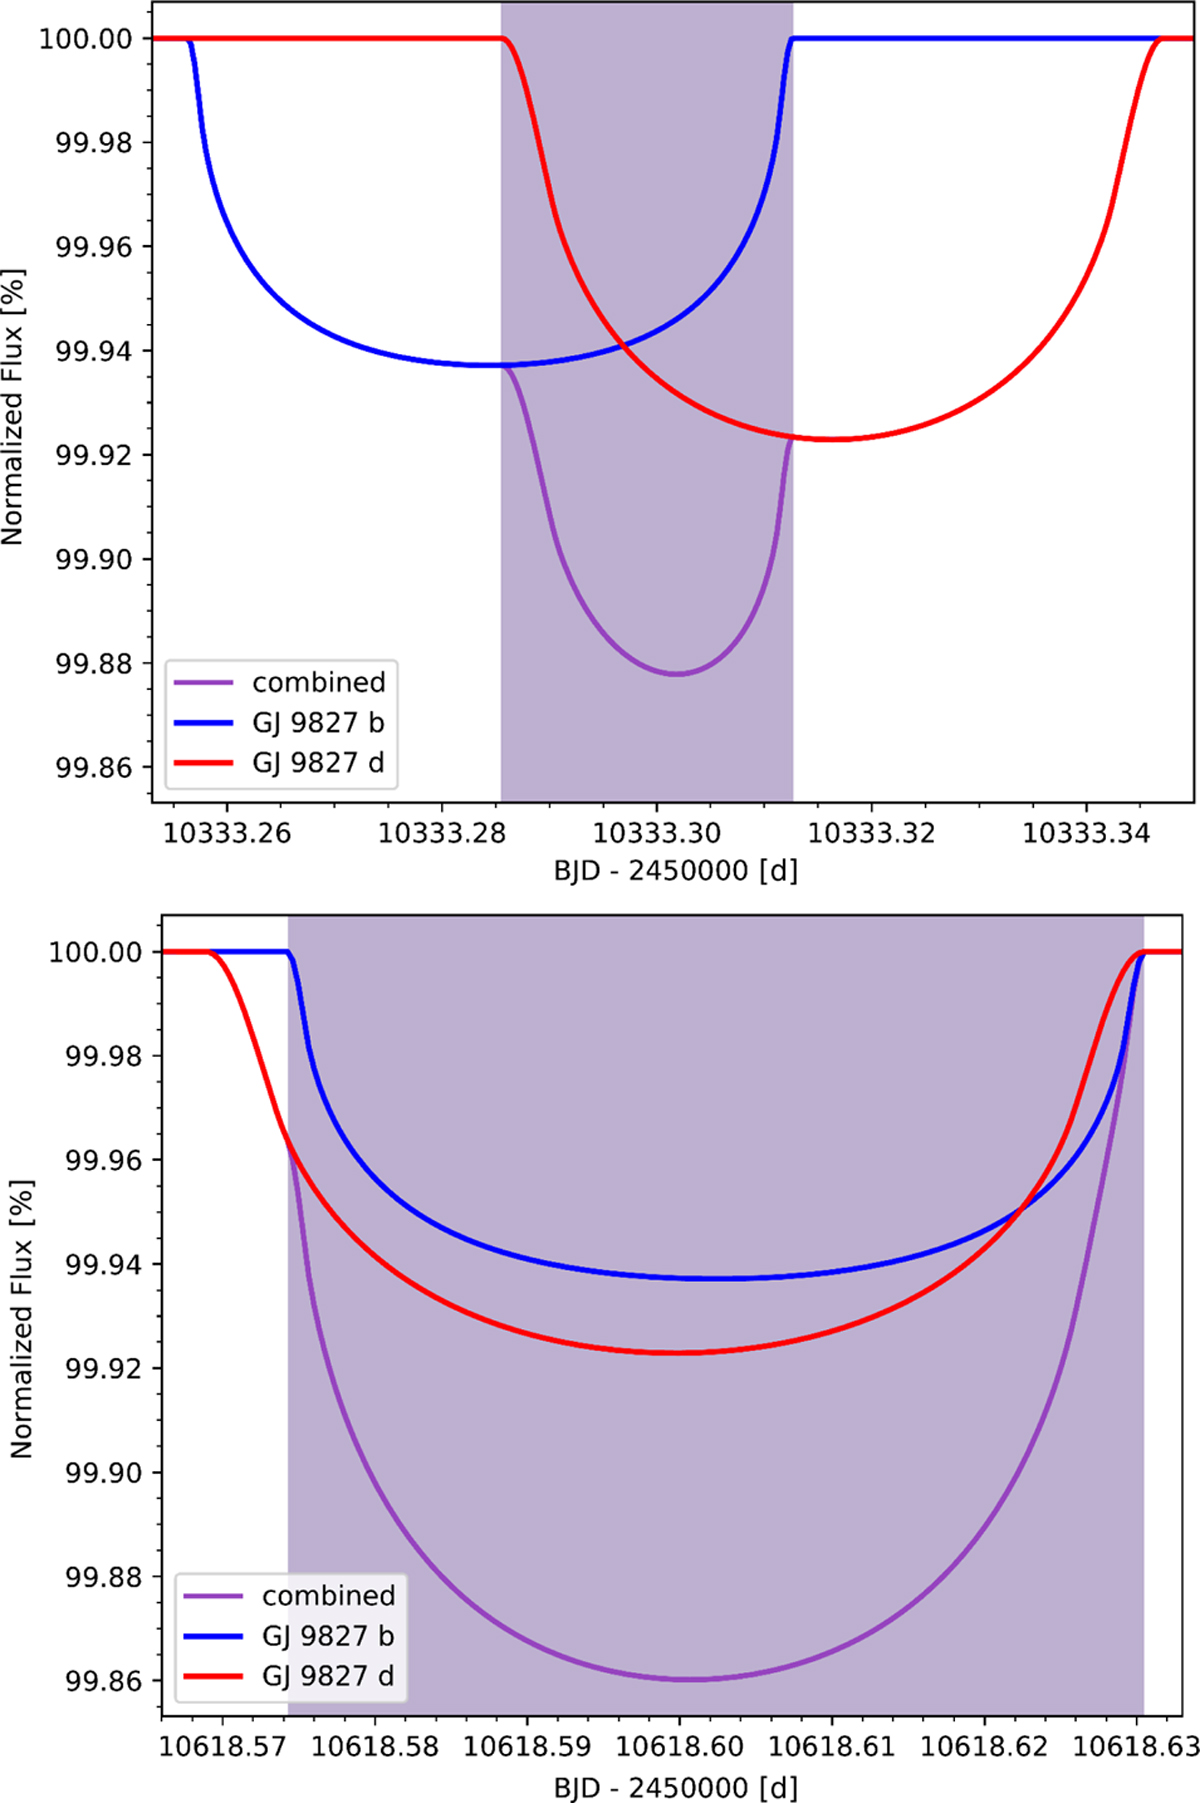
Simulated light curves of multi transits of GJ 9827 b and GJ 9827 d starting at BJD 2460333.25 d (top) and 2460618.57 d (bottom). The latter event is the deepest in this series.
Current usage metrics show cumulative count of Article Views (full-text article views including HTML views, PDF and ePub downloads, according to the available data) and Abstracts Views on Vision4Press platform.
Data correspond to usage on the plateform after 2015. The current usage metrics is available 48-96 hours after online publication and is updated daily on week days.
Initial download of the metrics may take a while.