Fig. 6.
Download original image
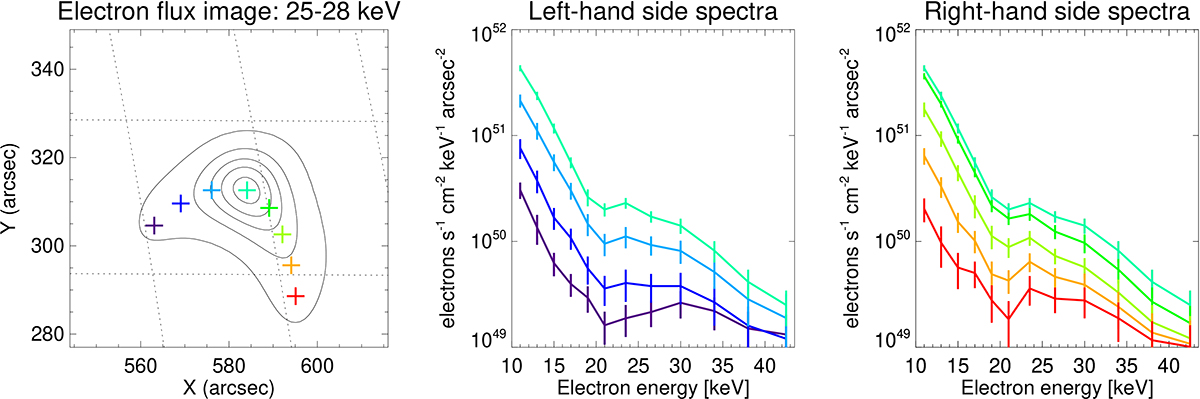
SOL2021-05-08T18 event. Left panel: electron flux map in the energy channel 25–28 keV, with seven locations identified in the loop. Middle panel: regularized electron flux spectra at four locations in the left side of the flaring loop with corresponding uncertainties. Right panel: regularized electron flux spectra at five locations in the right side of the flaring loop, with corresponding uncertainties. The spectra are obtained by considering areas of 5 × 5 arcsec around each of the selected points and averaging the corresponding spectra. The spectra clearly show two components: a thermal component below ∼20 keV and a nonthermal component at higher energies.
Current usage metrics show cumulative count of Article Views (full-text article views including HTML views, PDF and ePub downloads, according to the available data) and Abstracts Views on Vision4Press platform.
Data correspond to usage on the plateform after 2015. The current usage metrics is available 48-96 hours after online publication and is updated daily on week days.
Initial download of the metrics may take a while.