Fig. 5.
Download original image
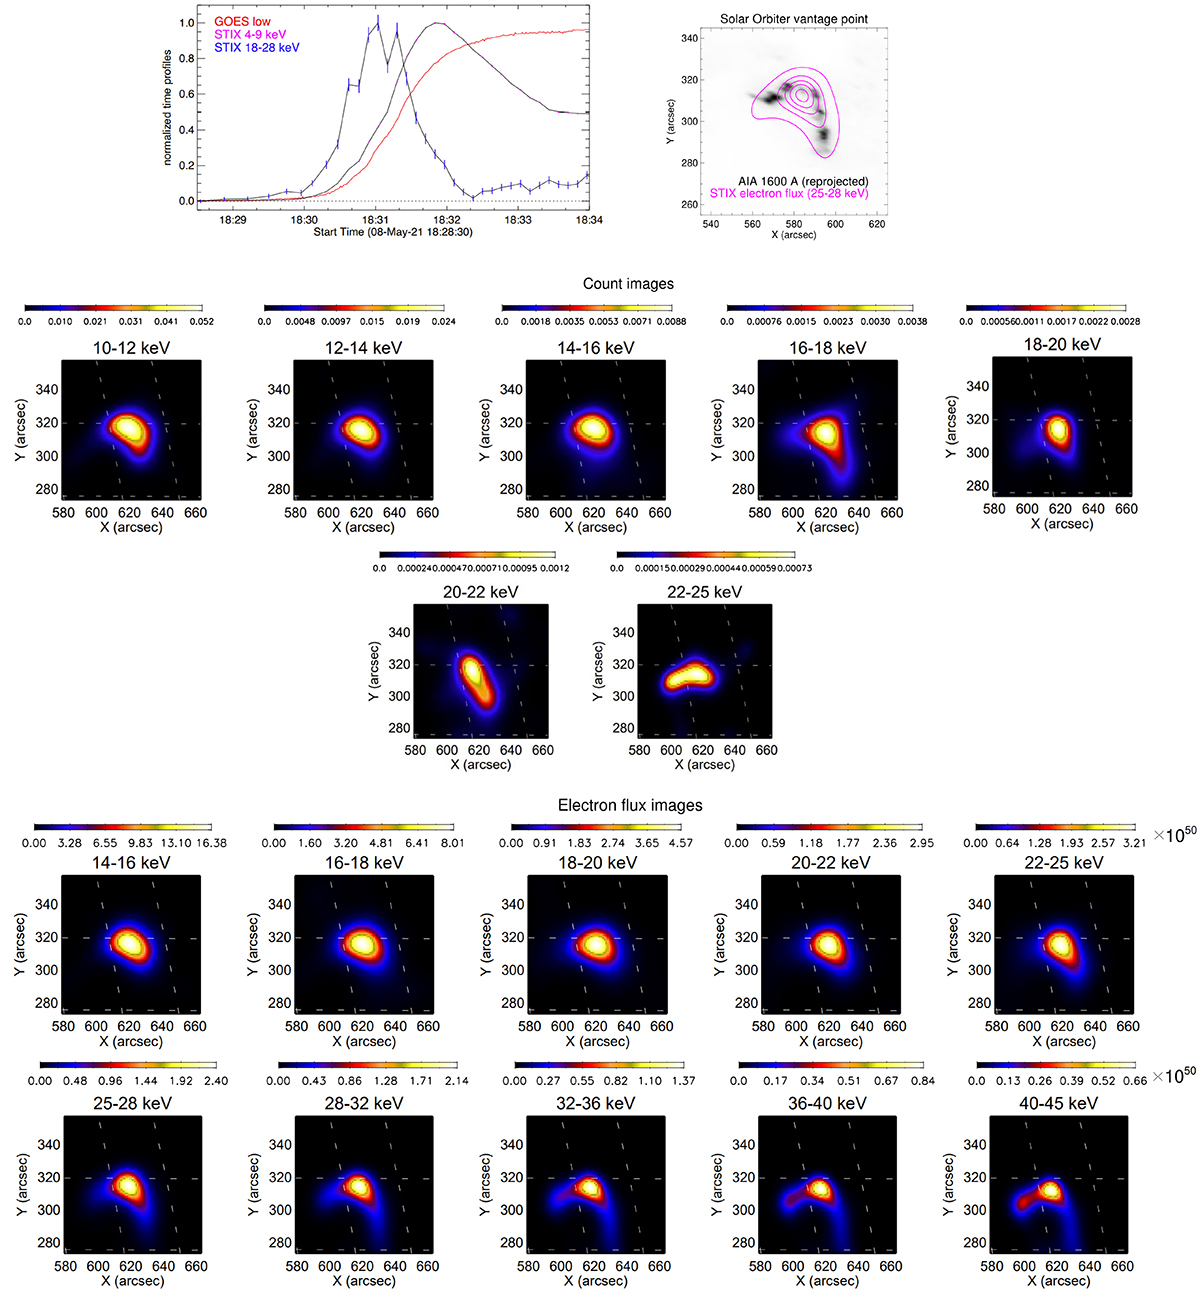
SOL2021-05-08T18 event. Top left panel: normalized GOES and STIX time profiles. Top right panel: electron flux contour plots, provided by the MEM_GE algorithm from STIX electron visibilities, overlaid on the AIA map, which has been re-projected to match the viewing angle from STIX. The 10, 30, 50, 70, and 90% contour levels of the reconstructed electron flux (25–28 keV) are plotted in magenta. Middle panels: count images obtained by appying the MEM_GE algorithm to visibilities recorded at different energies. The units of the map pixels are counts cm−2 s−1 keV−1 arcsec−2. Bottom panels: electron flux images in different energy channels as reconstructed by the MEM_GE algorithm. The units of the map pixels are 1050 × electrons cm−2 s−1 keV−1 arcsec−2.
Current usage metrics show cumulative count of Article Views (full-text article views including HTML views, PDF and ePub downloads, according to the available data) and Abstracts Views on Vision4Press platform.
Data correspond to usage on the plateform after 2015. The current usage metrics is available 48-96 hours after online publication and is updated daily on week days.
Initial download of the metrics may take a while.