Fig. 4.
Download original image
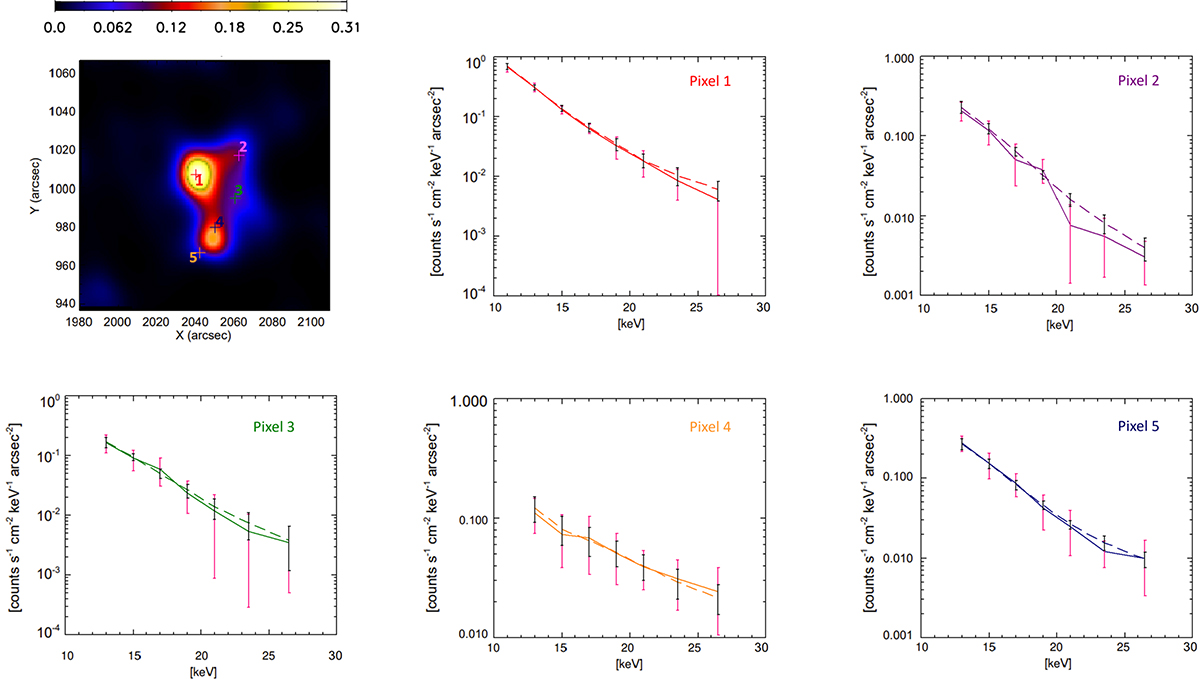
Spatially resolved count spectra for the SOL2022-09-29T14 event. Top left panel: regularized count image corresponding to the energy range 12–14 keV, selected pixels are indicated with colored crosses. The units of the map pixels are counts cm−2 s−1 keV−1 arcsec−2. Other panels show the corresponding pixel-wise spectra obtained from count images (solid line) and regularized count images (dashed line) as a function of count energy. The pixels selected in the top left panel and their respective spectra are indicated with the same color. The plots are logarithmically scaled on the y-axis. The (3σ) error bars on the count spectra are in pink, while the error bars on the regularized count spectra are in black.
Current usage metrics show cumulative count of Article Views (full-text article views including HTML views, PDF and ePub downloads, according to the available data) and Abstracts Views on Vision4Press platform.
Data correspond to usage on the plateform after 2015. The current usage metrics is available 48-96 hours after online publication and is updated daily on week days.
Initial download of the metrics may take a while.