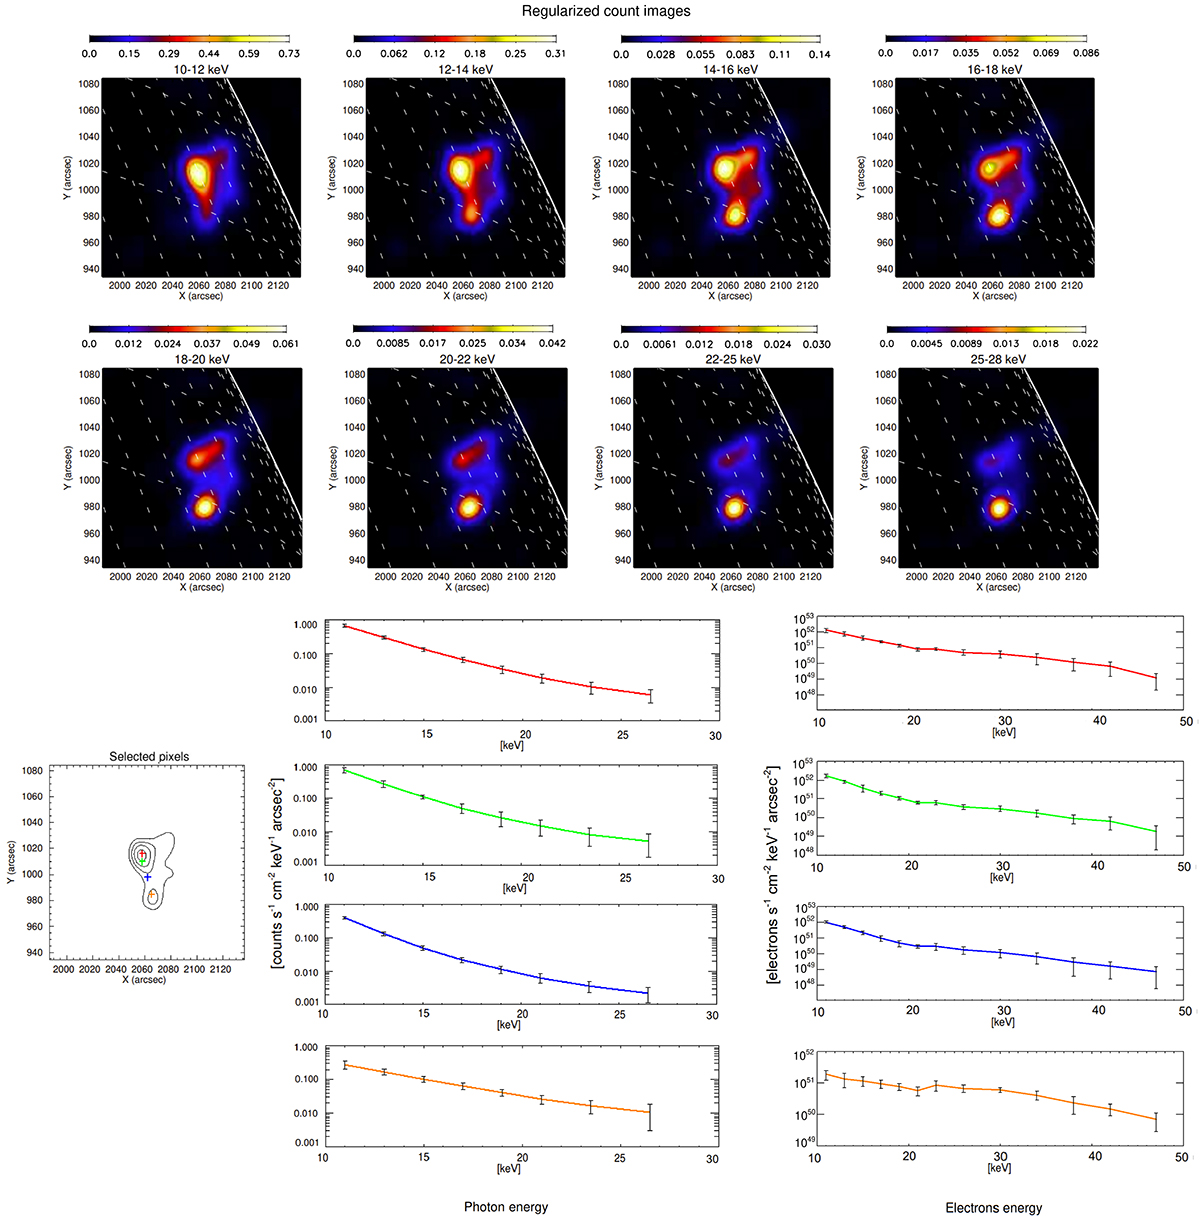
Fig. 3.
Download original image
SOL2022-09-29T14 event. Top panels: regularized count images in different energy channels for the SOL2022-09-29T14 event, as reconstructed by MEM_GE. The units of the map pixels are counts cm−2 s−1 keV−1 arcsec−2. Bottom left panel: 30, 50, 70 and 90% countour levels of the regularized count map corresponding to the energy range 12–14 keV. Selected locations are indicated with colored crosses. Middle column: spectra at different locations obtained from the regularized count images. Right column: pixel-wise spectra obtained from the regularized electron flux spectral images.
Current usage metrics show cumulative count of Article Views (full-text article views including HTML views, PDF and ePub downloads, according to the available data) and Abstracts Views on Vision4Press platform.
Data correspond to usage on the plateform after 2015. The current usage metrics is available 48-96 hours after online publication and is updated daily on week days.
Initial download of the metrics may take a while.