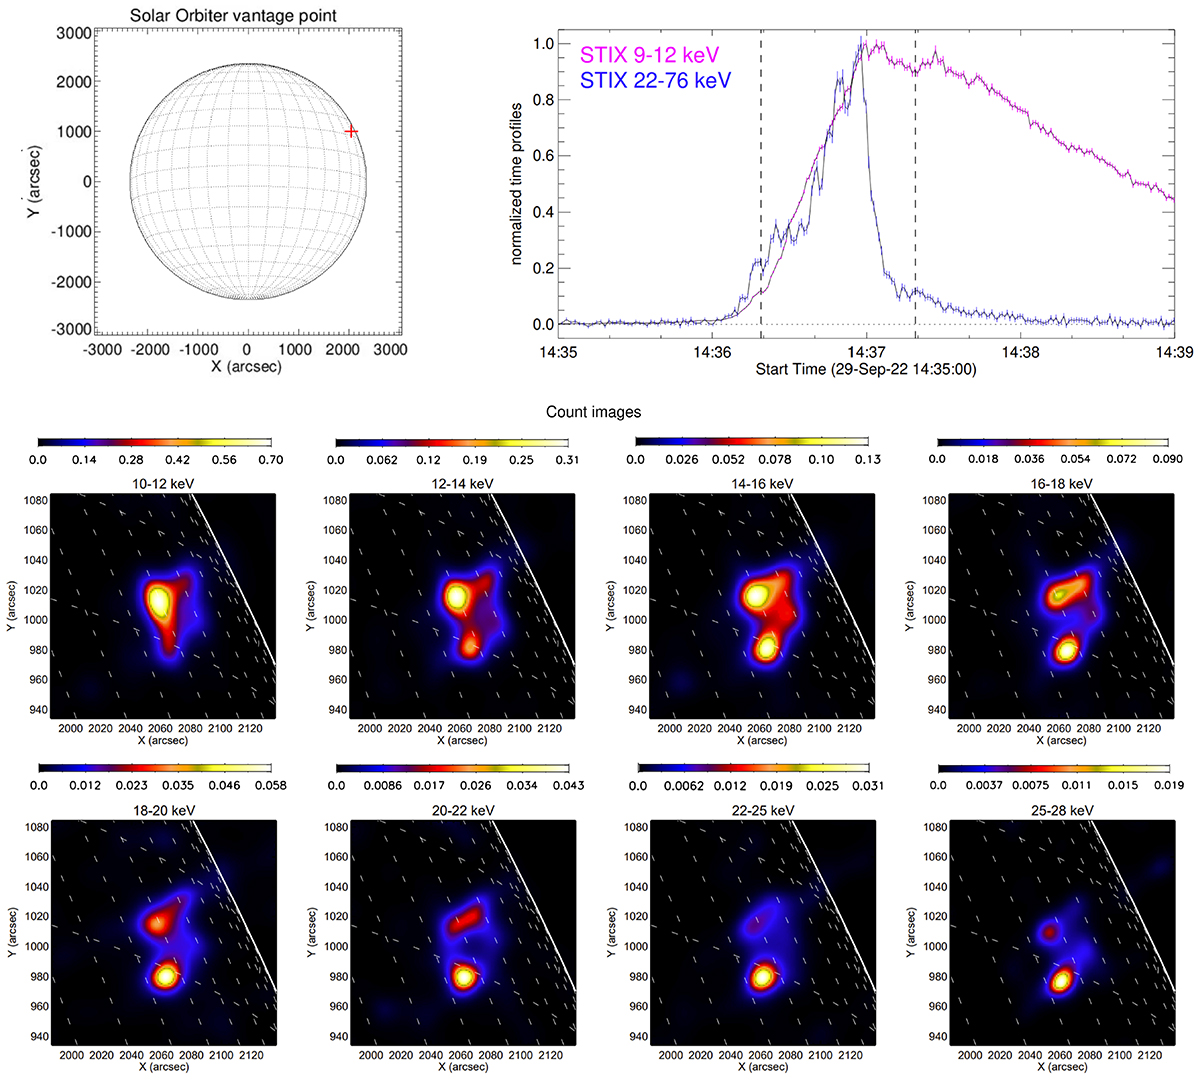
Fig. 1.
Download original image
SOL2022-09-29T14 event. Top row, left panel: position of the event on the solar disk; right panel: normalized STIX time profiles corresponding to the energy ranges 9–12 keV and 22–76 keV. The reported time is relative to Solar Orbiter. Bottom row: count images of the event at different energies as reconstructed by MEM_GE. The units of the map pixels are counts cm−2 s−1 keV−1 arcsec−2.
Current usage metrics show cumulative count of Article Views (full-text article views including HTML views, PDF and ePub downloads, according to the available data) and Abstracts Views on Vision4Press platform.
Data correspond to usage on the plateform after 2015. The current usage metrics is available 48-96 hours after online publication and is updated daily on week days.
Initial download of the metrics may take a while.