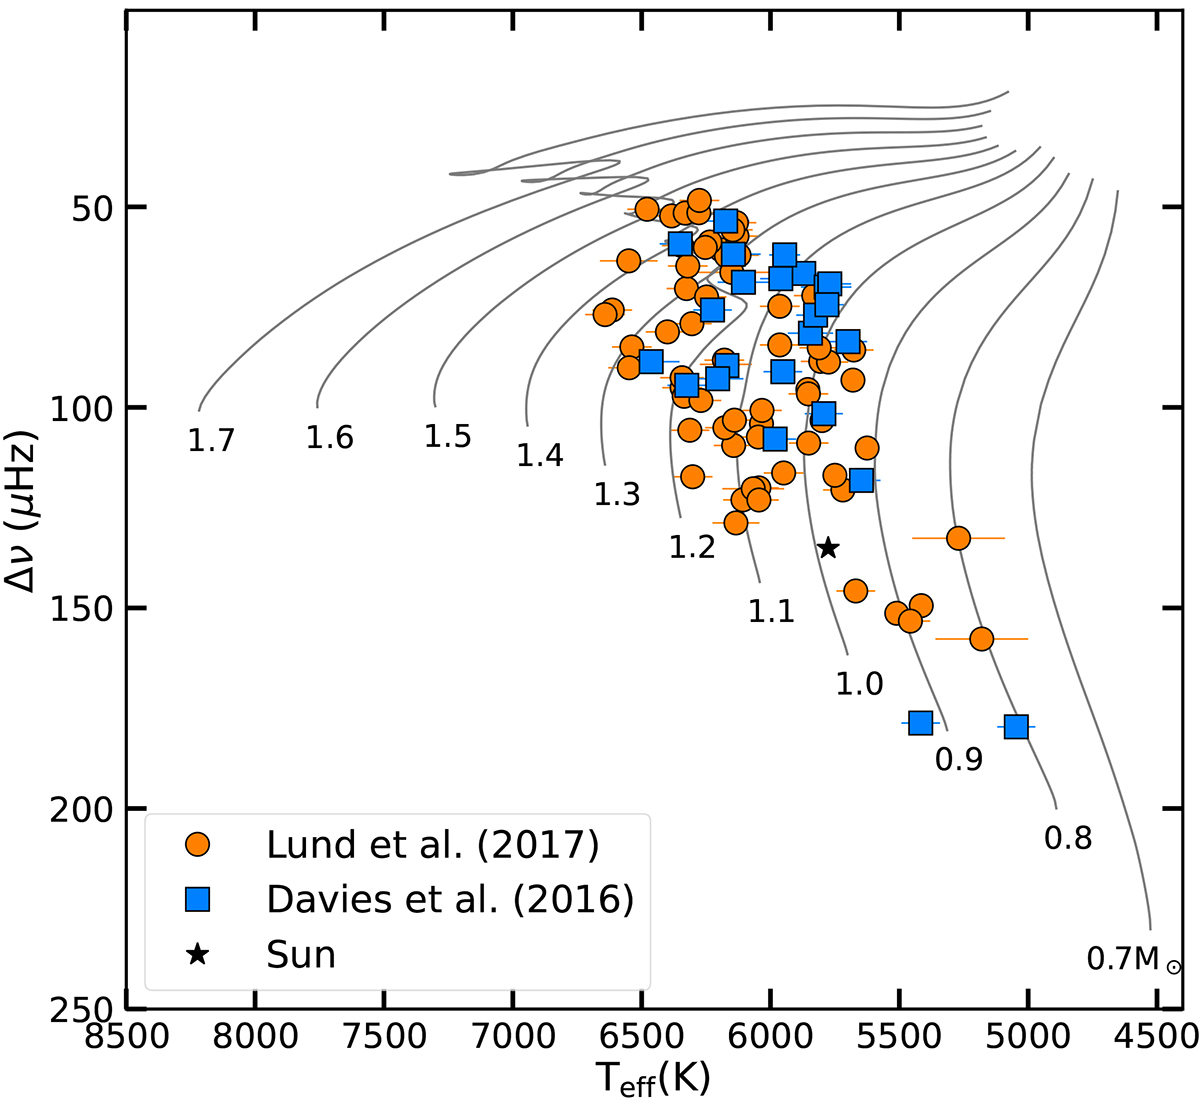
Fig. 1.
Download original image
Asteroseismic diagram showing some computed evolutionary tracks with [M/H]i = 0.0 and Yi = 0.26 (that are not the Solar values) in solid black lines. The points show the distribution of the sample considered in this work, where the orange circles are taken from L17, the blue squares are from D16, and the black star is the Sun.
Current usage metrics show cumulative count of Article Views (full-text article views including HTML views, PDF and ePub downloads, according to the available data) and Abstracts Views on Vision4Press platform.
Data correspond to usage on the plateform after 2015. The current usage metrics is available 48-96 hours after online publication and is updated daily on week days.
Initial download of the metrics may take a while.