Fig. 4.
Download original image
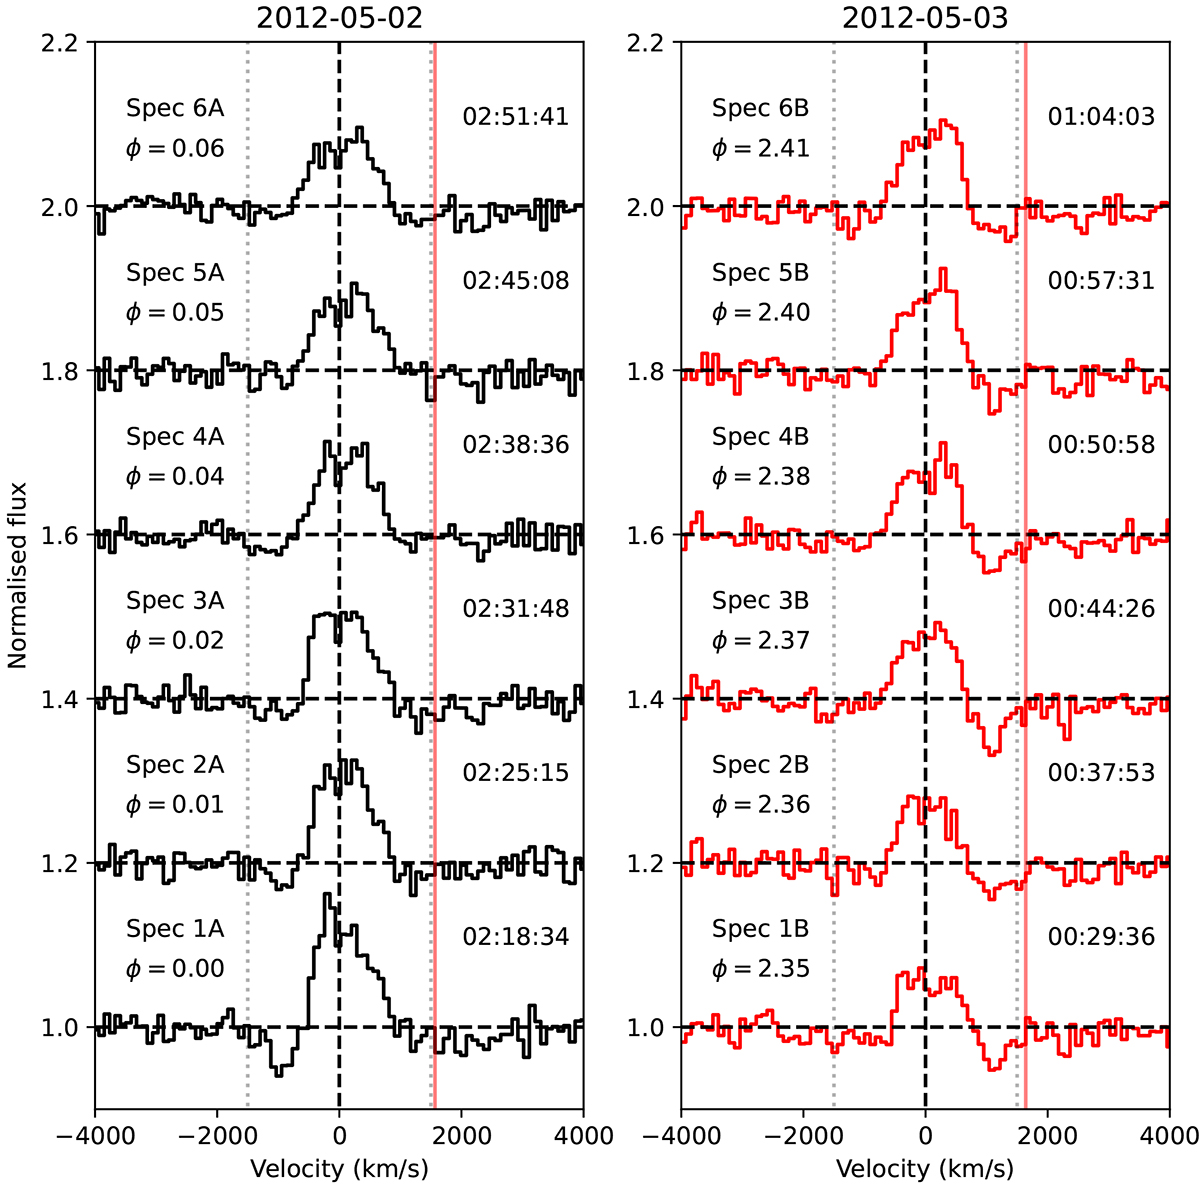
Individual Hα emission lines from the spectra obtained during epoch A (black) and epoch B (red) of the optical observations. The dotted black lines mark the maximum terminal velocity observed in the blueshifted and redshifted absorption features (±1500 km s−1). The solid red line marks the intersection between CCDs, proving that the redshifted features, when present, are not due to a normalisation issue. The normalised profiles have been separated vertically by a constant offset for visual purposes.
Current usage metrics show cumulative count of Article Views (full-text article views including HTML views, PDF and ePub downloads, according to the available data) and Abstracts Views on Vision4Press platform.
Data correspond to usage on the plateform after 2015. The current usage metrics is available 48-96 hours after online publication and is updated daily on week days.
Initial download of the metrics may take a while.