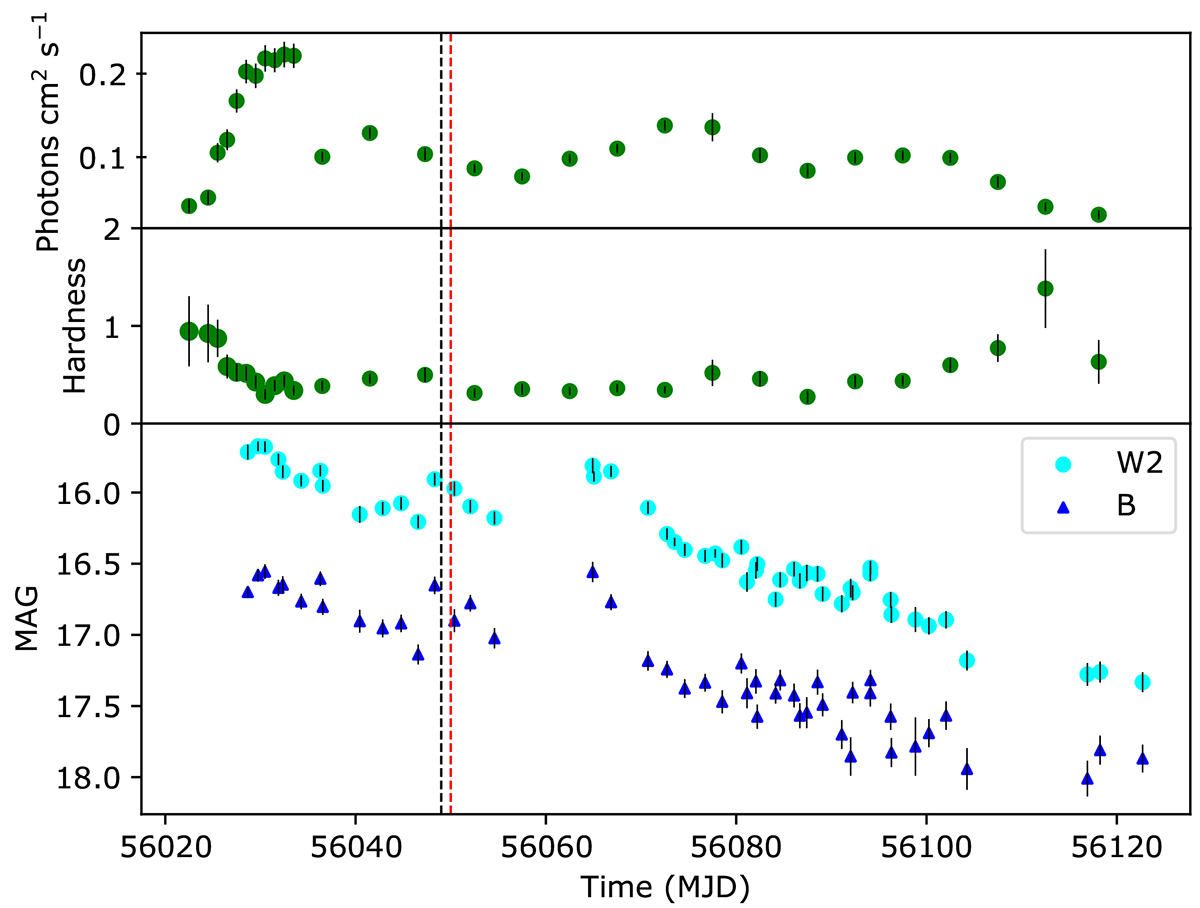
Fig. 1.
Download original image
X-ray and UV/optical light curves of the source. Top panel: Light curve of MAXI J1305-704 from the 2 − 10 keV band count rate provided by MAXI. Middle panel: Hardness-ratio data constructed from the 2 − 4 keV and 4 − 10 keV energy band count rate provided by MAXI. Bottom panel: UVOT light curve in the W2 ultraviolet and B optical band. The dotted black and red lines represent our optical observations of epochs A and B, respectively.
Current usage metrics show cumulative count of Article Views (full-text article views including HTML views, PDF and ePub downloads, according to the available data) and Abstracts Views on Vision4Press platform.
Data correspond to usage on the plateform after 2015. The current usage metrics is available 48-96 hours after online publication and is updated daily on week days.
Initial download of the metrics may take a while.