Fig. B.1.
Download original image
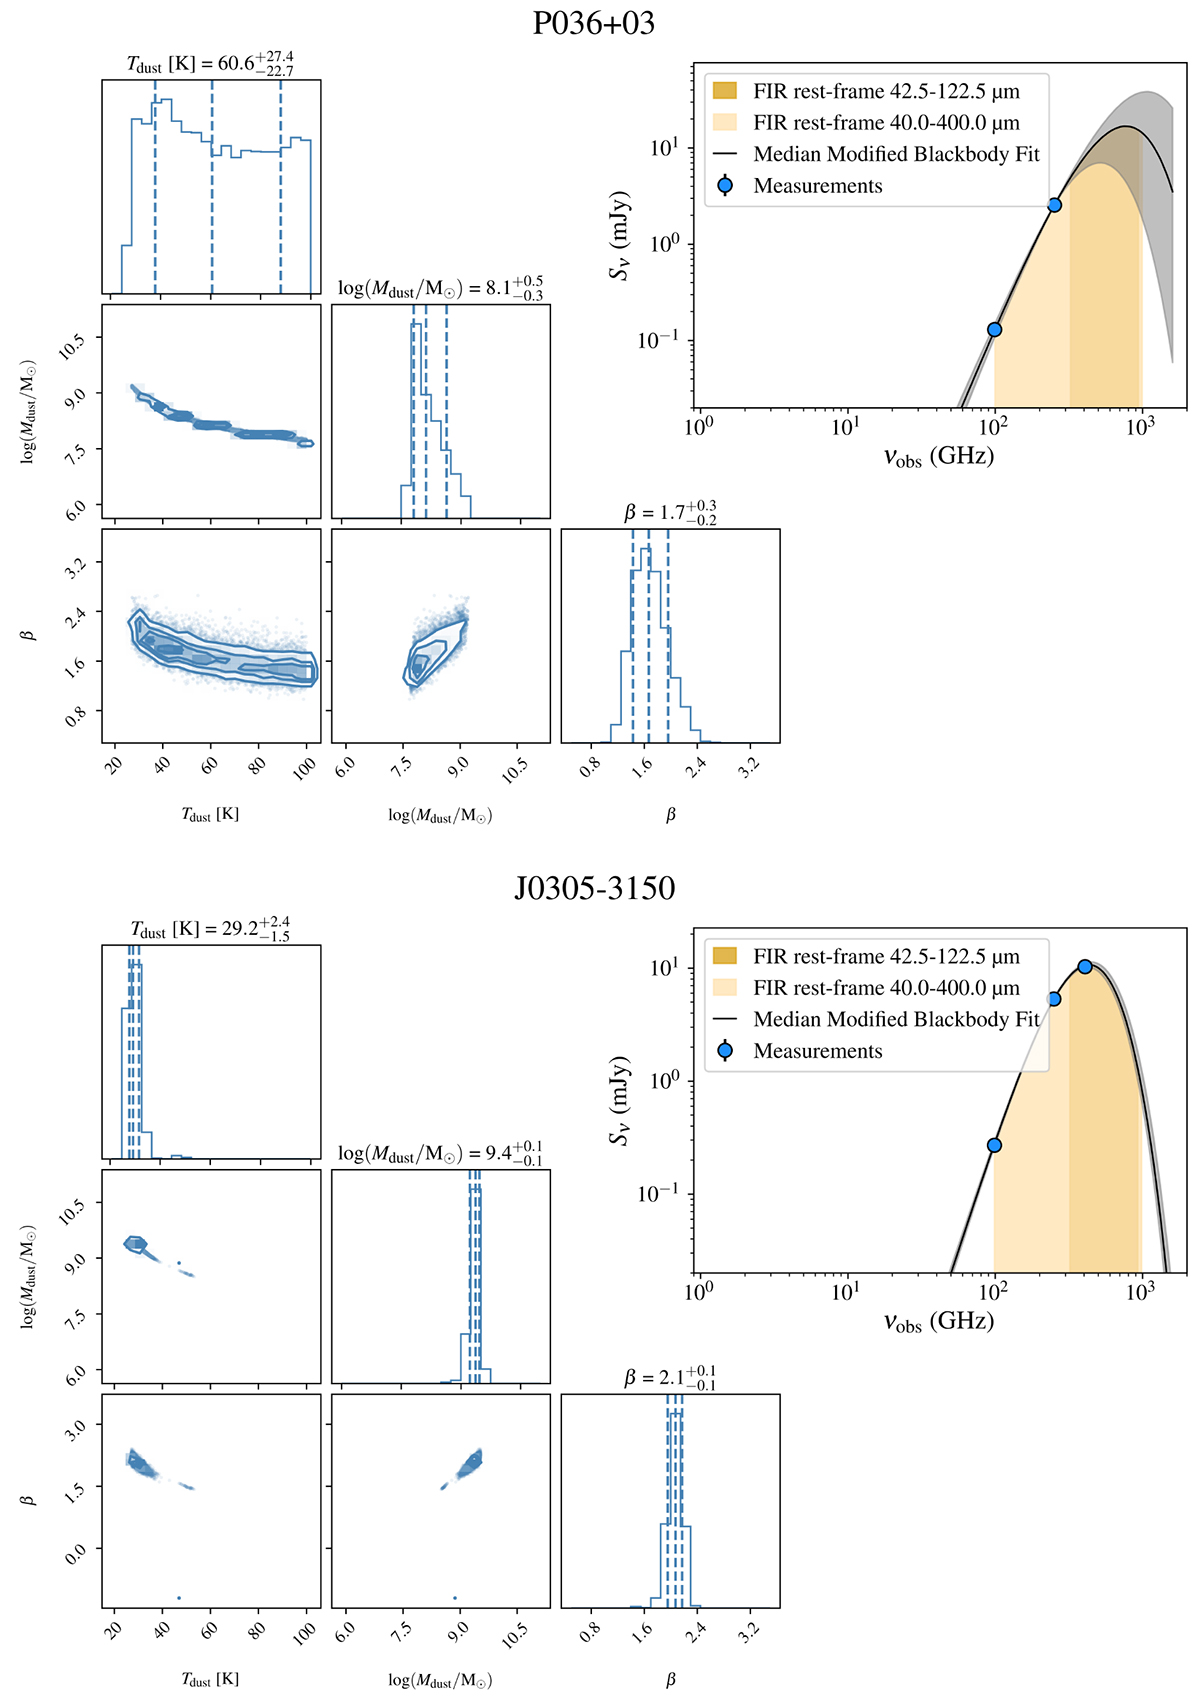
Outputs of the Bayesian dust SED fitting for our three QSO hosts. For each source (labelled at top), the top right panel shows the best-fit dust models (solid lines) and the observed fluxes (blue and purple points). The data that were included in the fits are shown in light blue, those not included in purple. The remaining panels from top left to bottom right show the marginalised likelihood distributions for the three fit parameters: dust temperature (Tdust), mass (Mdust), and emissivity index (β).
Current usage metrics show cumulative count of Article Views (full-text article views including HTML views, PDF and ePub downloads, according to the available data) and Abstracts Views on Vision4Press platform.
Data correspond to usage on the plateform after 2015. The current usage metrics is available 48-96 hours after online publication and is updated daily on week days.
Initial download of the metrics may take a while.