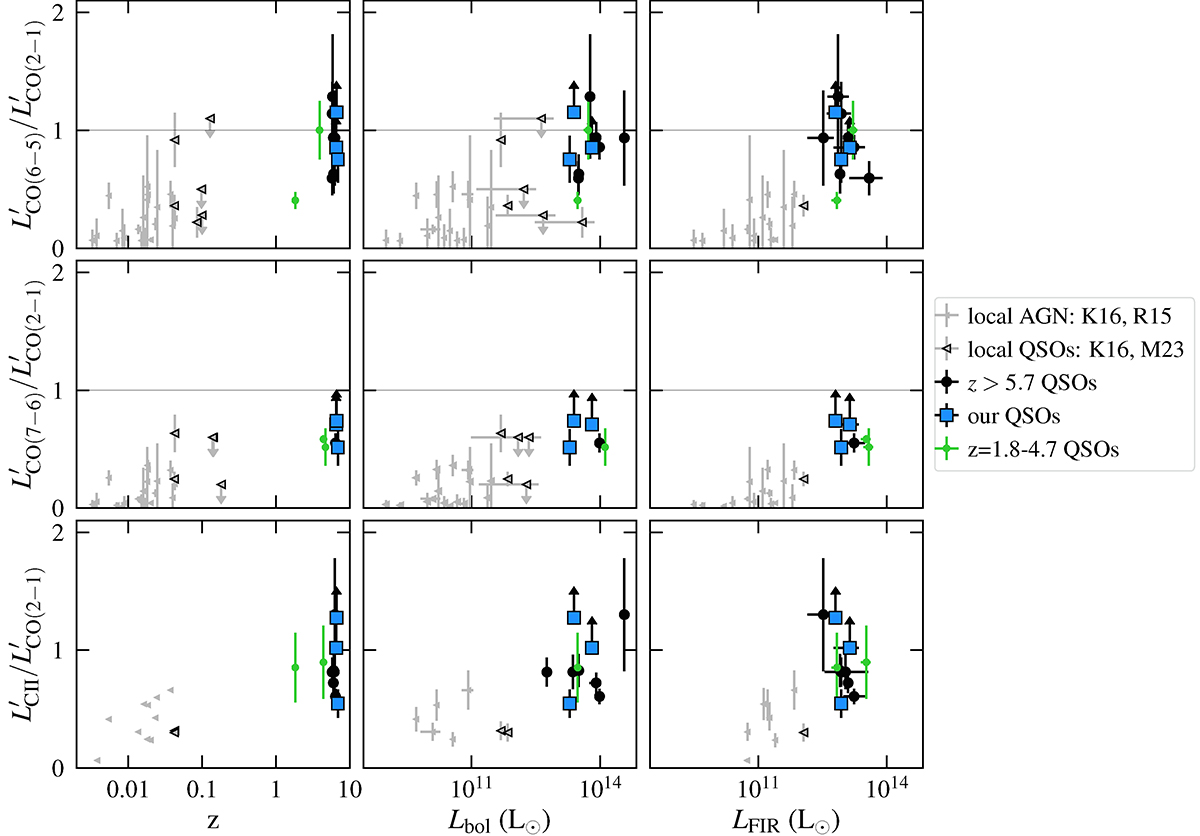
Fig. 6.
Download original image
Line luminosity ratios versus redshift (left column), Lbol (middle), and LFIR, 40 − 400 μm (right). The data for the three QSO hosts studied here are depicted via filled squares, whereas the previously studied z ≳ 6 QSO hosts are depicted by filled circles. The colour-coding is the same as for Fig. 4. We also show the local AGN and QSO hosts from Kamenetzky et al. (2016) and Molyneux et al. (2024; grey and black, respectively) and a few z = 1 − 4 QSO hosts from Riechers et al. (2008, 2009), Aravena et al. (2008), corrected for lensing where appropriate (green circles). The bolometric luminosities of the different samples were inferred in different ways: scaling the 3000 Å luminosity following Shen et al. (2011) for the z ≳ 6 QSO hosts, scaling the luminosity at 14–150 keV following Ricci et al. (2017) for the local sample (BASS catalogue of Koss et al. 2022) and scaling the [O III]λ5007 Å line luminosity for the sample of Molyneux et al. (2024). For the z = 1 − 4 QSO hosts we use values determined from the [O III]λ5007 Å line, 6 μm emission, or the full spectral fitting. The FIR luminosities of the z < 4 samples were taken from the same studies, based on their SED fitting, whereas for the z ≳ 6 QSOs, we use the values derived in this work.
Current usage metrics show cumulative count of Article Views (full-text article views including HTML views, PDF and ePub downloads, according to the available data) and Abstracts Views on Vision4Press platform.
Data correspond to usage on the plateform after 2015. The current usage metrics is available 48-96 hours after online publication and is updated daily on week days.
Initial download of the metrics may take a while.