Fig. 5.
Download original image
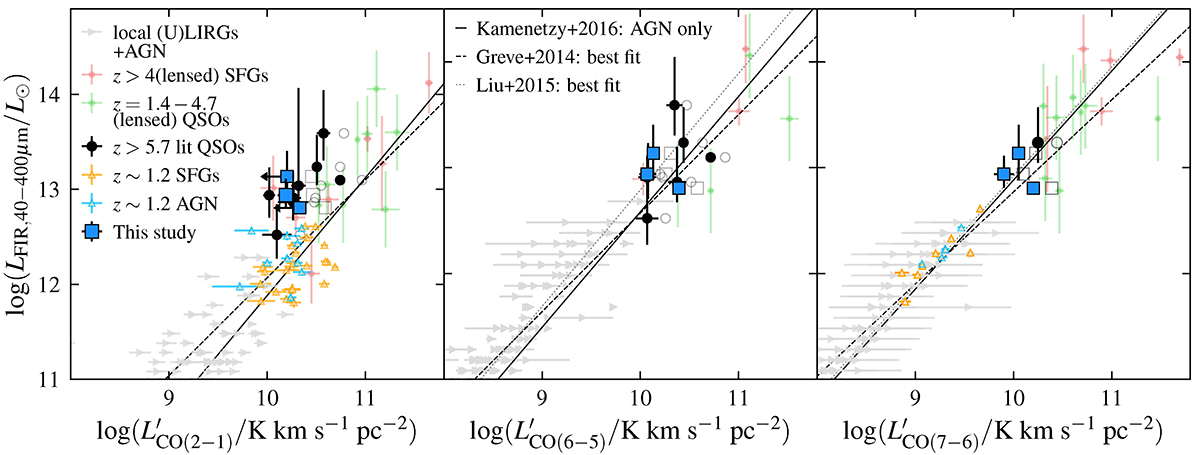
FIR luminosities versus CO line luminosities of our three QSOs (coloured squares), the literature sample of z ≳ 6 QSOs (filled, coloured circles), the z > 3 SFGs in Table A.2 (orange circles), the z ∼ 1.2 star-forming galaxies and AGN from Valentino et al. (2020; orange and blue triangles), and the local (U)LIRGS, AGN, and QSOs from Rosenberg et al. (2015) and Kamenetzky et al. (2016; grey, right-pointing triangles). The z ≳ 6 QSOs follow the literature relations for the CO(6–5) and CO(7–6) transitions but are shifted to 2–6× lower CO(2–1) line luminosities than predicted by these relations.
Current usage metrics show cumulative count of Article Views (full-text article views including HTML views, PDF and ePub downloads, according to the available data) and Abstracts Views on Vision4Press platform.
Data correspond to usage on the plateform after 2015. The current usage metrics is available 48-96 hours after online publication and is updated daily on week days.
Initial download of the metrics may take a while.