Fig. 2.
Download original image
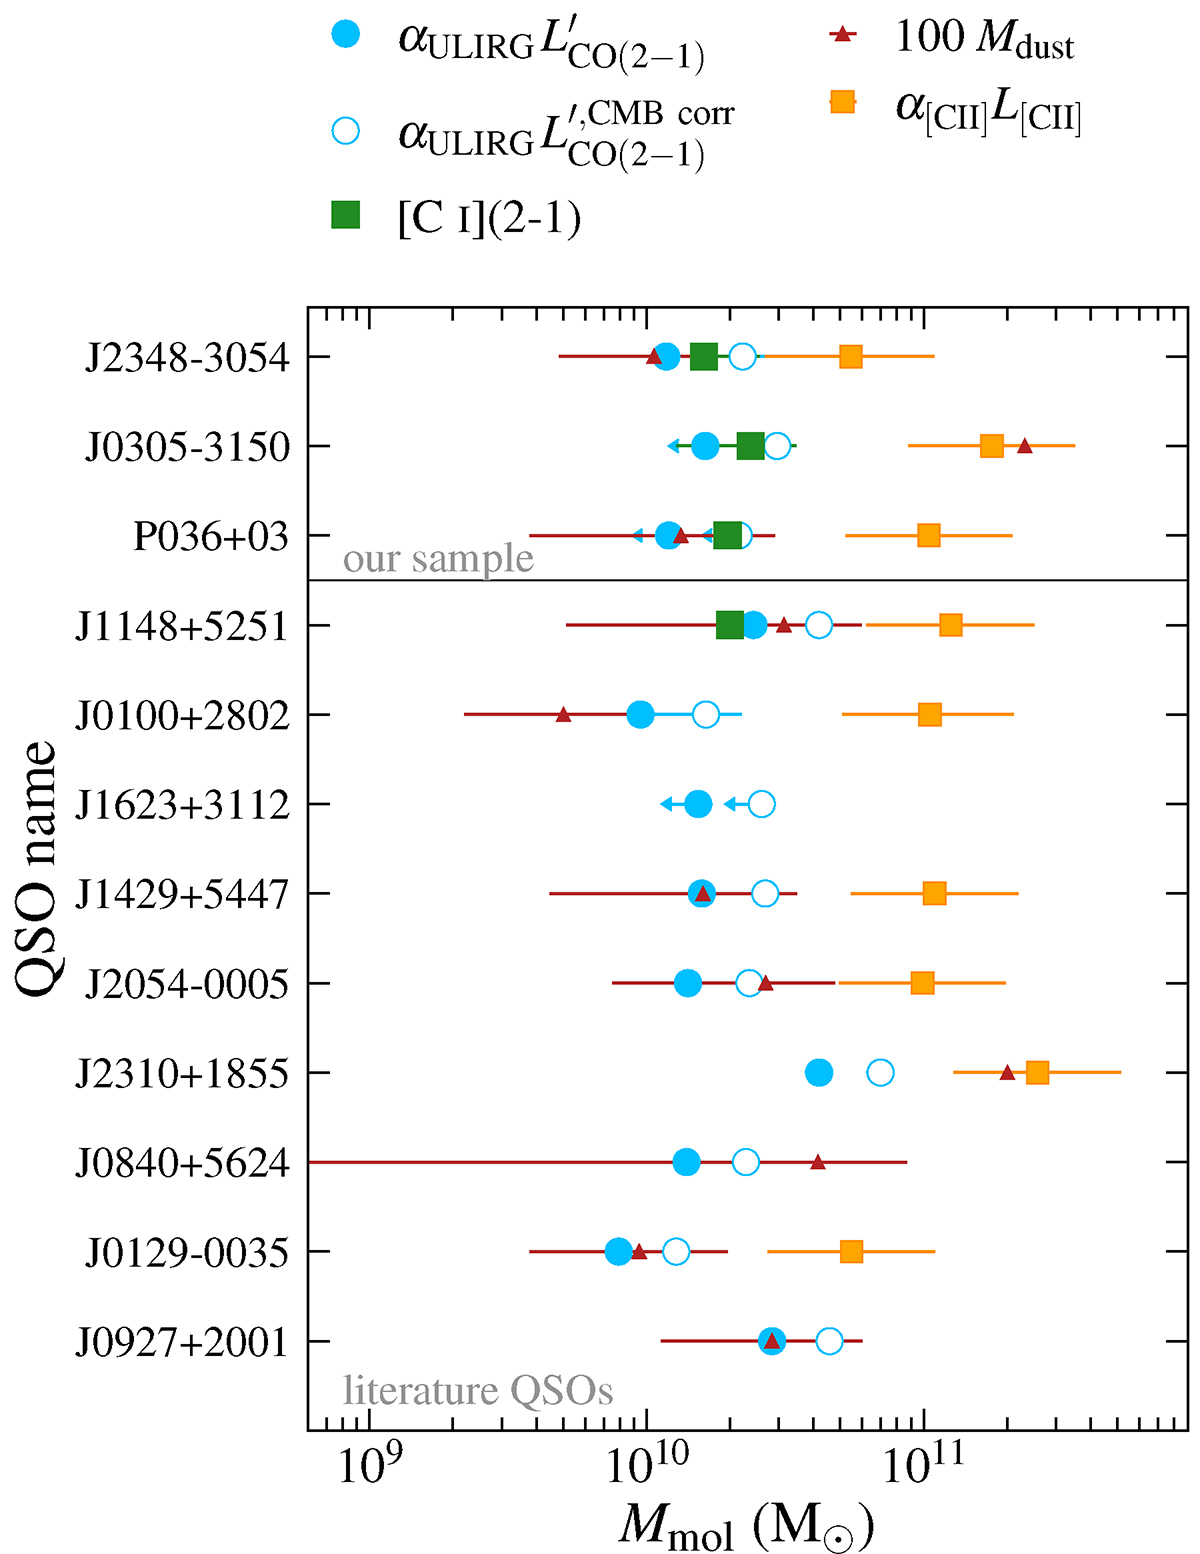
Comparison of molecular gas masses inferred from different sets of observations for our three QSO hosts (top three) and the literature sample of z ≳ 6 QSO hosts (bottom nine). For the CO-based values, we have assumed a ULIRG CO-to-H2 conversion factor of αCO = 0.8 M⊙ (K km s−1 pc2)−1. We show two masses for CO(2–1), one derived without any CMB correction being applied (filled blue circles) and one derived by applying a correction assuming the high-density (nH2 = 104.2 cm−3) and high-temperature (Tkin = 40 K), non-LTE scenario presented in da Cunha et al. (2013a; blue outlined circles). We also show molecular gas masses derived from [C I] (2–1) emission (green squares) assuming the [C I] is optically thin, in LTE and has the same abundance as the sample of lensed starbursts studied in Harrington et al. (2021), namely [C I]/H2 = (6.82 ± 3.04)×10−5. We also compare to molecular gas masses derived from the dust masses fit here, assuming the local gas-to-dust ratio of 100 (red triangles), as well as molecular gas masses derived from the [C II] 158 μm line luminosities, assuming the mean [C II]-to-H2 conversion factor (α[CII] = 31 M⊙/L⊙) derived by Zanella et al. (2018).
Current usage metrics show cumulative count of Article Views (full-text article views including HTML views, PDF and ePub downloads, according to the available data) and Abstracts Views on Vision4Press platform.
Data correspond to usage on the plateform after 2015. The current usage metrics is available 48-96 hours after online publication and is updated daily on week days.
Initial download of the metrics may take a while.