Fig. 1.

Download original image
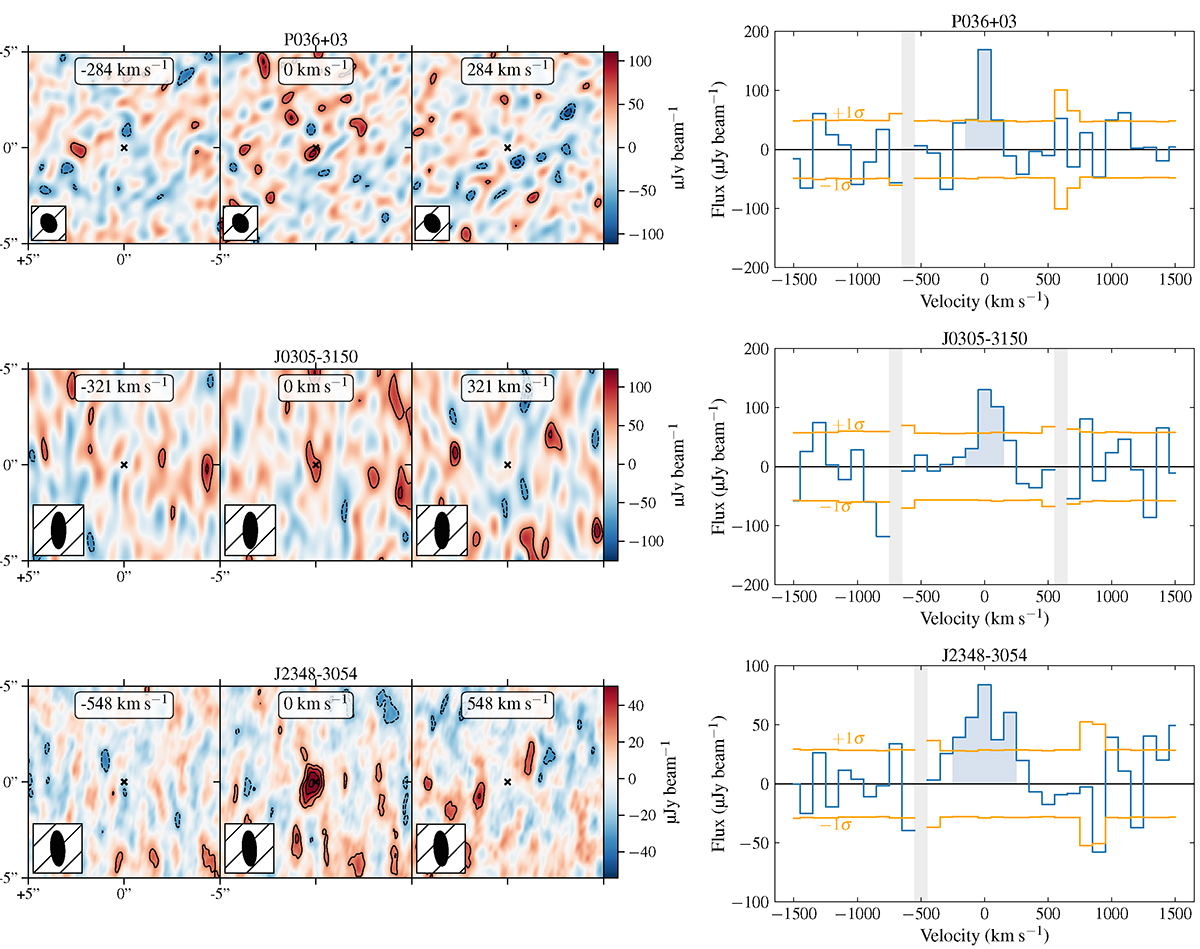
CO(2–1) observations of P036+03, J0305–3150, and J2348–3054 (from top to bottom, respectively). Left: Cleaned channel maps with the middle panel depicting the moment-0 map centred on the [C II] 158 μm redshift and integrated over 1.2× FWHM of the [C II] 158 μm line, which should encompass 84% of the CO(2–1) emission assuming there is no spatial or velocity offset. Right: Observed CO(2–1) spectra extracted from the pixel at the peak position of the moment 0 maps (blue line) and 1σ rms per channel (orange line). The spectra are shown for channels of 100 km s−1 velocity width, the shaded region indicating the 1.2 FWHM region used to create the channel maps to the left. P036+03 and J0305–3150 are undetected (with a significant number of negative and positive peaks in the data cube exceeding the significance of the peaks in emission near the expected source centres), so we place 4σ upper limits on their CO(2–1) emission. J2348–3054 is detected at 5.1σ (central velocity-integrated map in bottom row).
Current usage metrics show cumulative count of Article Views (full-text article views including HTML views, PDF and ePub downloads, according to the available data) and Abstracts Views on Vision4Press platform.
Data correspond to usage on the plateform after 2015. The current usage metrics is available 48-96 hours after online publication and is updated daily on week days.
Initial download of the metrics may take a while.


