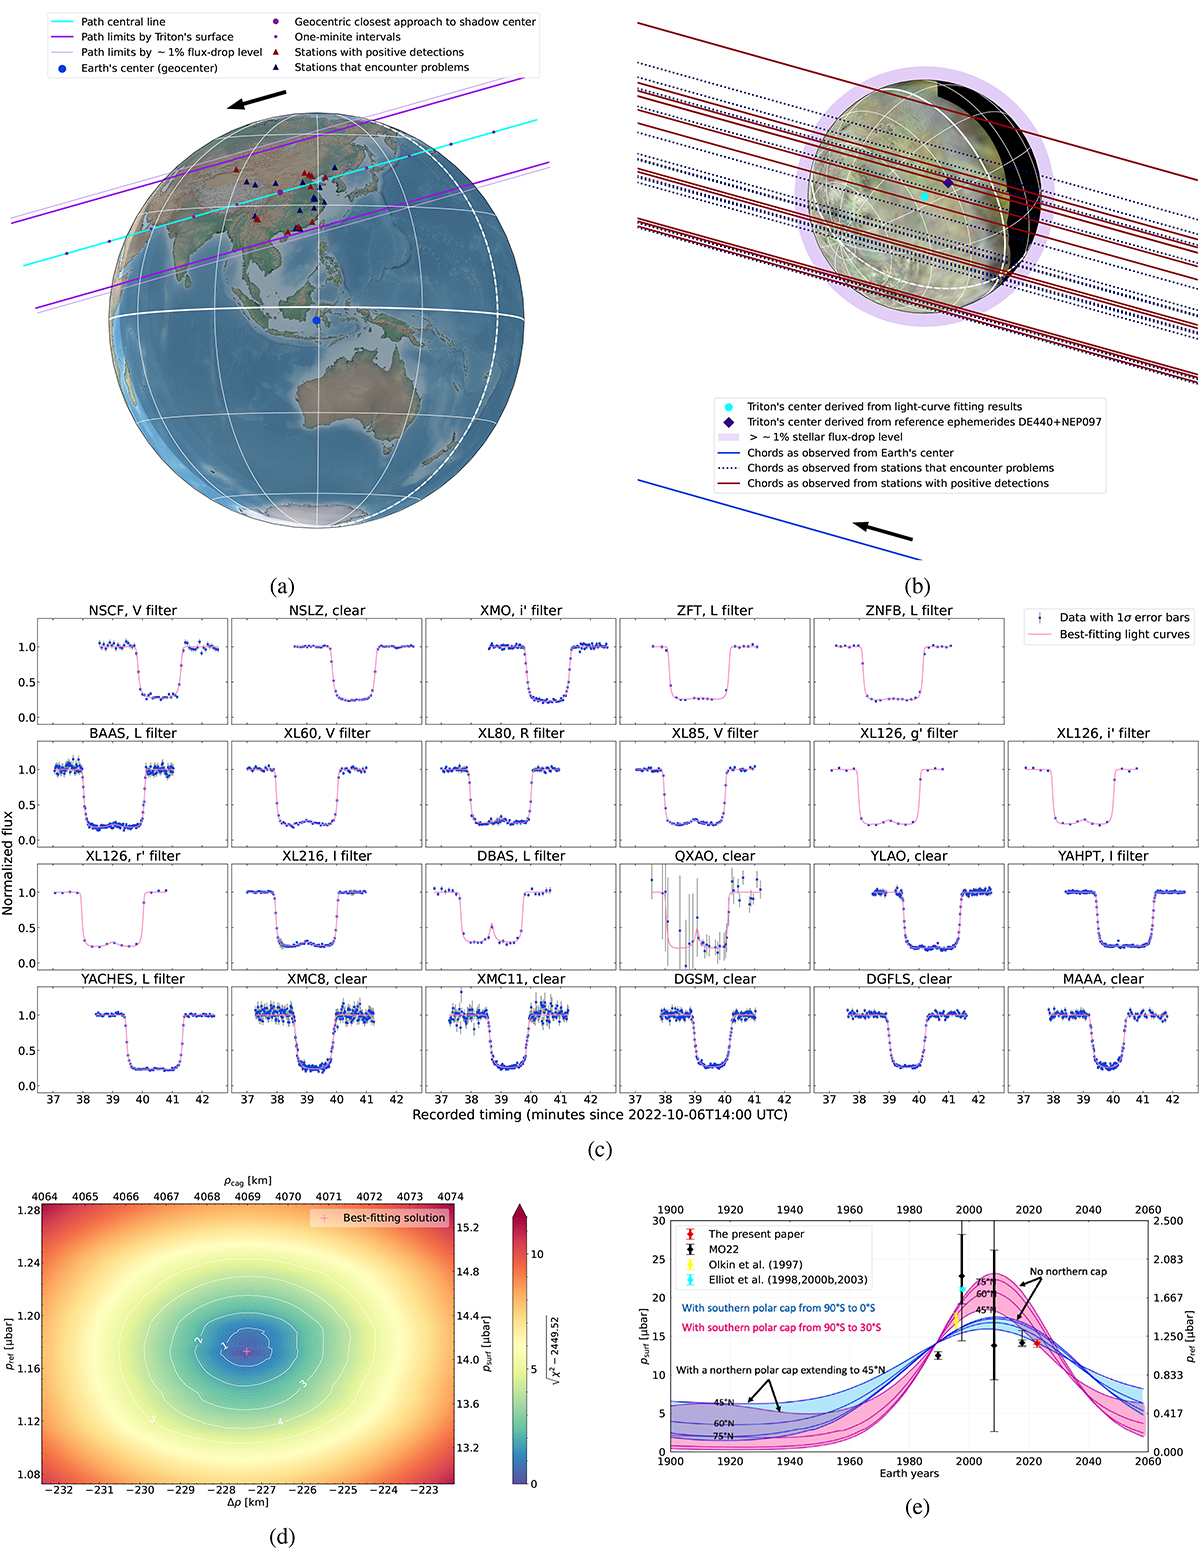
Fig. 1.
Download original image
Results of the 6 October 2022 occultation. Panel a: Reconstructed occultation map. Panel b: Reconstructed occultation chords relative to Triton. Panel c: Simultaneous fit of 23 light curves. Panel d: χ2 map for the simultaneous fit of 23 light curves. Panel e: Pressure measurements compared with the VTM22 simulations of Triton’s surface pressure cycle. The simulations are denoted by the blue and pink curves, which are obtained from Fig. 23 of MO22. The 1σ and 3σ uncertainties on pressure measurements are denoted by the thicker and thinner error bars, respectively, which are derived from the χ2 maps in MO22.
Current usage metrics show cumulative count of Article Views (full-text article views including HTML views, PDF and ePub downloads, according to the available data) and Abstracts Views on Vision4Press platform.
Data correspond to usage on the plateform after 2015. The current usage metrics is available 48-96 hours after online publication and is updated daily on week days.
Initial download of the metrics may take a while.