Open Access
Fig. 6.
Download original image
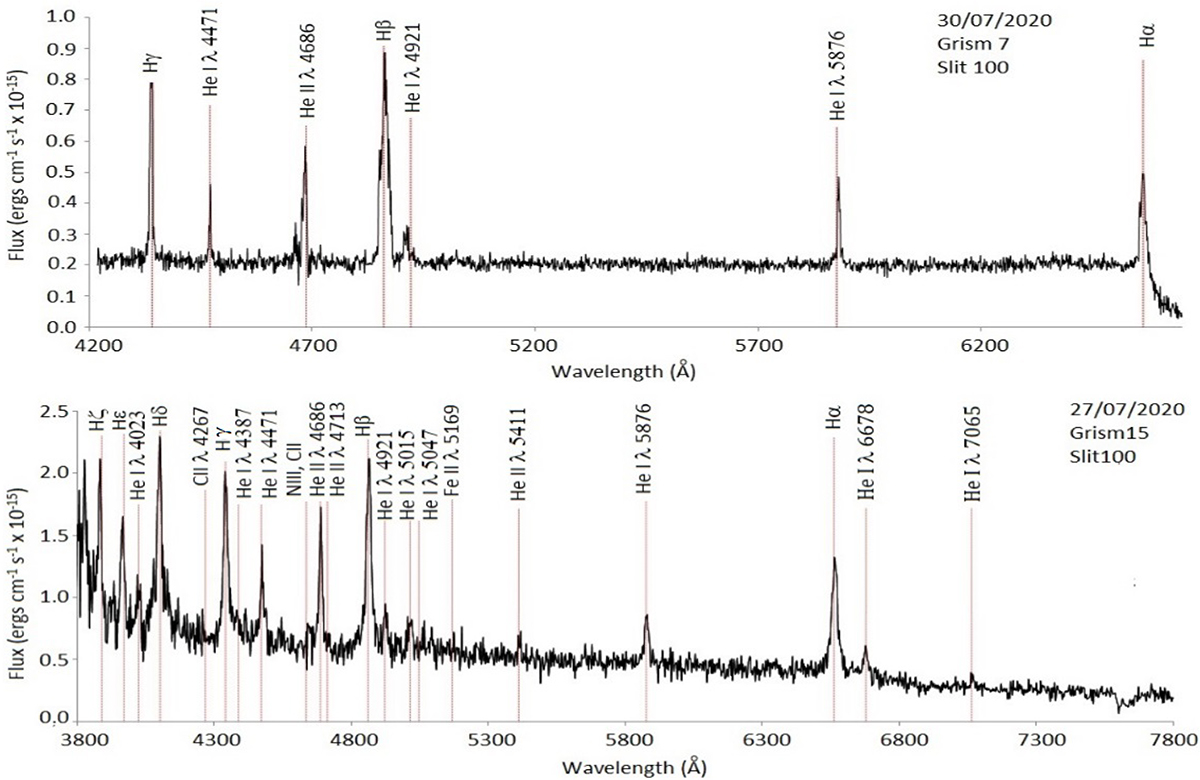
Two long-slit spectra of SRGA J213151.5+491400 obtained during the high state with grisms Nos. 7 and 15 in the top and bottom panels, respectively. Dates of observations are labeled on the panels. Some emission lines such as Balmer lines and low ionization lines such as He I and Fe II are marked in red on the spectra.
Current usage metrics show cumulative count of Article Views (full-text article views including HTML views, PDF and ePub downloads, according to the available data) and Abstracts Views on Vision4Press platform.
Data correspond to usage on the plateform after 2015. The current usage metrics is available 48-96 hours after online publication and is updated daily on week days.
Initial download of the metrics may take a while.