Open Access
Fig. 5.
Download original image
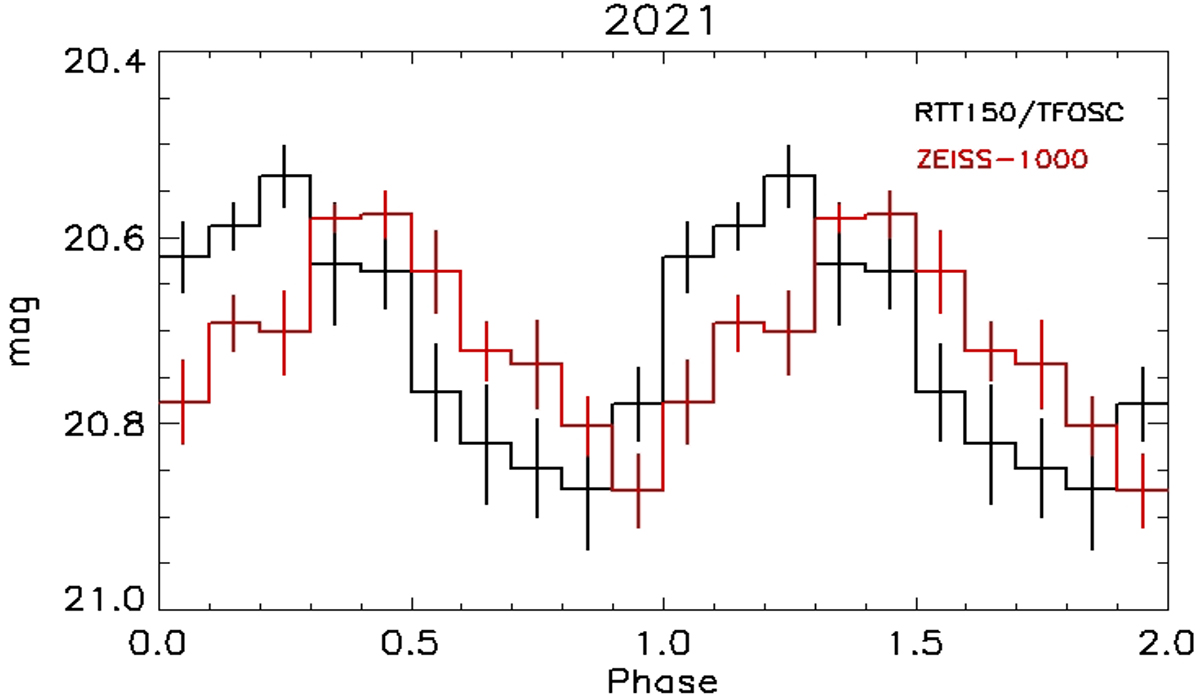
Mean light curve of SRGA J213151.5+491400 obtained with RTT150 in 2021 December using the g-band filter (SDSS) during the low state (in black). Overplotted is the mean light curve of the source obtained with Zeiss-1000 on 2021 October 9 using a clear filter (in red).
Current usage metrics show cumulative count of Article Views (full-text article views including HTML views, PDF and ePub downloads, according to the available data) and Abstracts Views on Vision4Press platform.
Data correspond to usage on the plateform after 2015. The current usage metrics is available 48-96 hours after online publication and is updated daily on week days.
Initial download of the metrics may take a while.