Fig. 4.
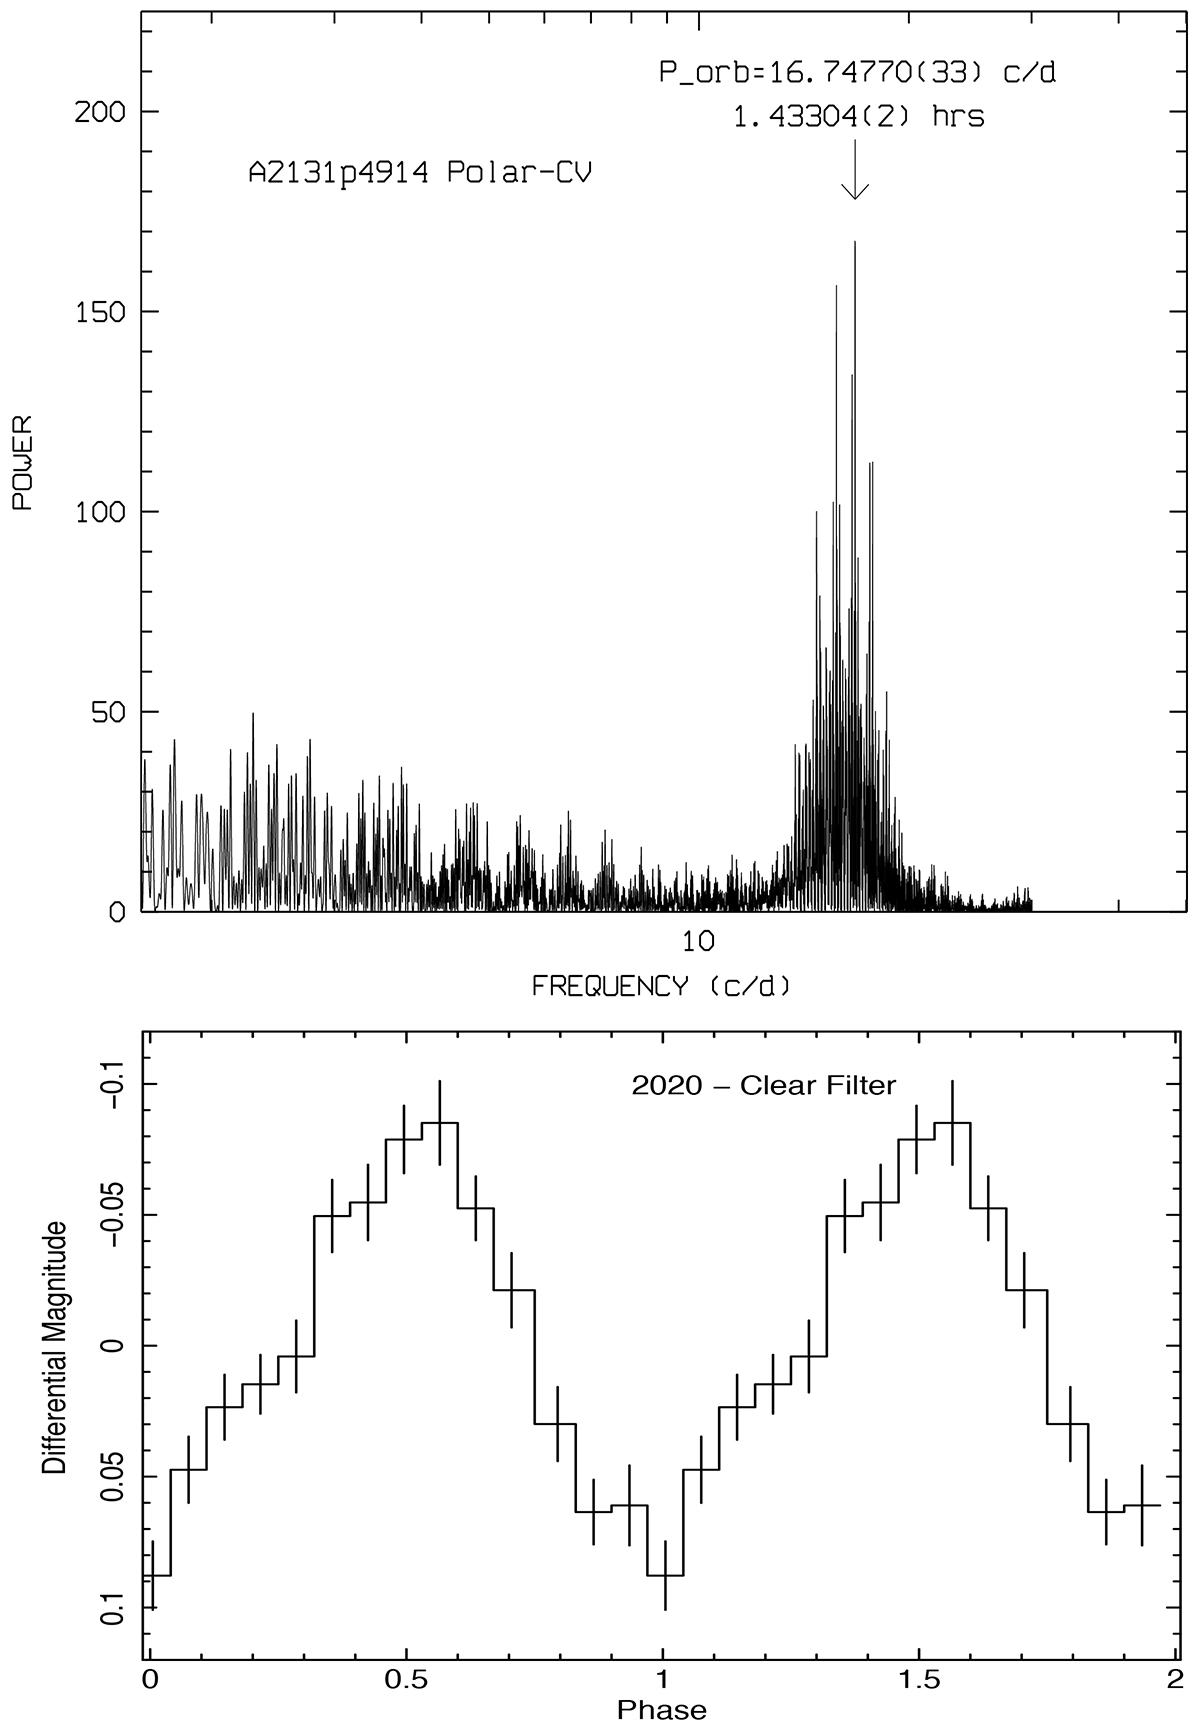
Download original image
Power spectrum and mean light curve in 2020. Top panel is the power spectrum of SRGA J213151.5+491400 derived from the entire ground-based photometric light curve in 2020 July–October (high state). The detected period is labeled on the figure. The bottom panel shows the mean light curve derived from the same data set in 2020 during the high state. The phases on the x-axis are with respect to the Tmin of the Ephemerides.
Current usage metrics show cumulative count of Article Views (full-text article views including HTML views, PDF and ePub downloads, according to the available data) and Abstracts Views on Vision4Press platform.
Data correspond to usage on the plateform after 2015. The current usage metrics is available 48-96 hours after online publication and is updated daily on week days.
Initial download of the metrics may take a while.