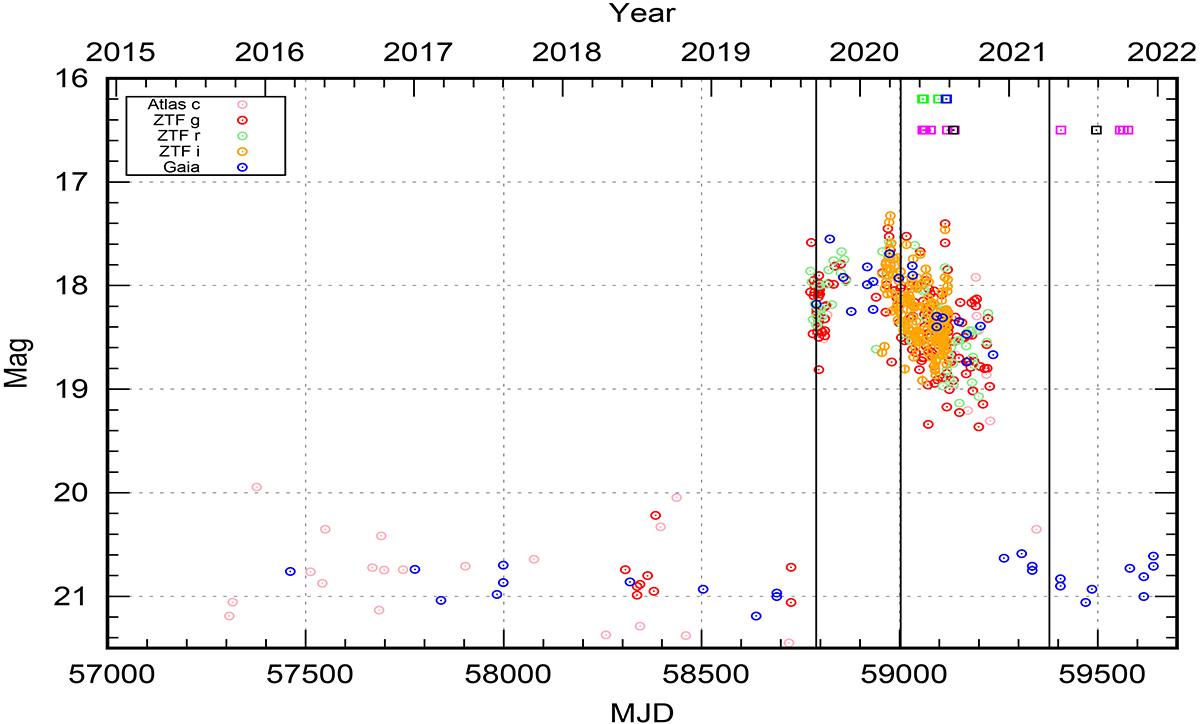
Fig. 2.
Download original image
Archival photometry of SRGA J213151.5+491400 in 2015−2022. The observations are (1) Gaia (blue); (2) ATLAS c (light pink); (3) ZTF g (red), r (light green) and i (yellow). The photometric and spectroscopic observations obtained from TUG (Türkiye) are represented with pink and green squares, respectively, while those obtained from SAO (Russia) are represented with black and blue squares. The vertical solid lines at MJD 58789, MJD 59003, and MJD 59378 indicate the dates of the Gaia alert, ART-XC detection and NICER start time, respectively.
Current usage metrics show cumulative count of Article Views (full-text article views including HTML views, PDF and ePub downloads, according to the available data) and Abstracts Views on Vision4Press platform.
Data correspond to usage on the plateform after 2015. The current usage metrics is available 48-96 hours after online publication and is updated daily on week days.
Initial download of the metrics may take a while.