Fig. 13.
Download original image
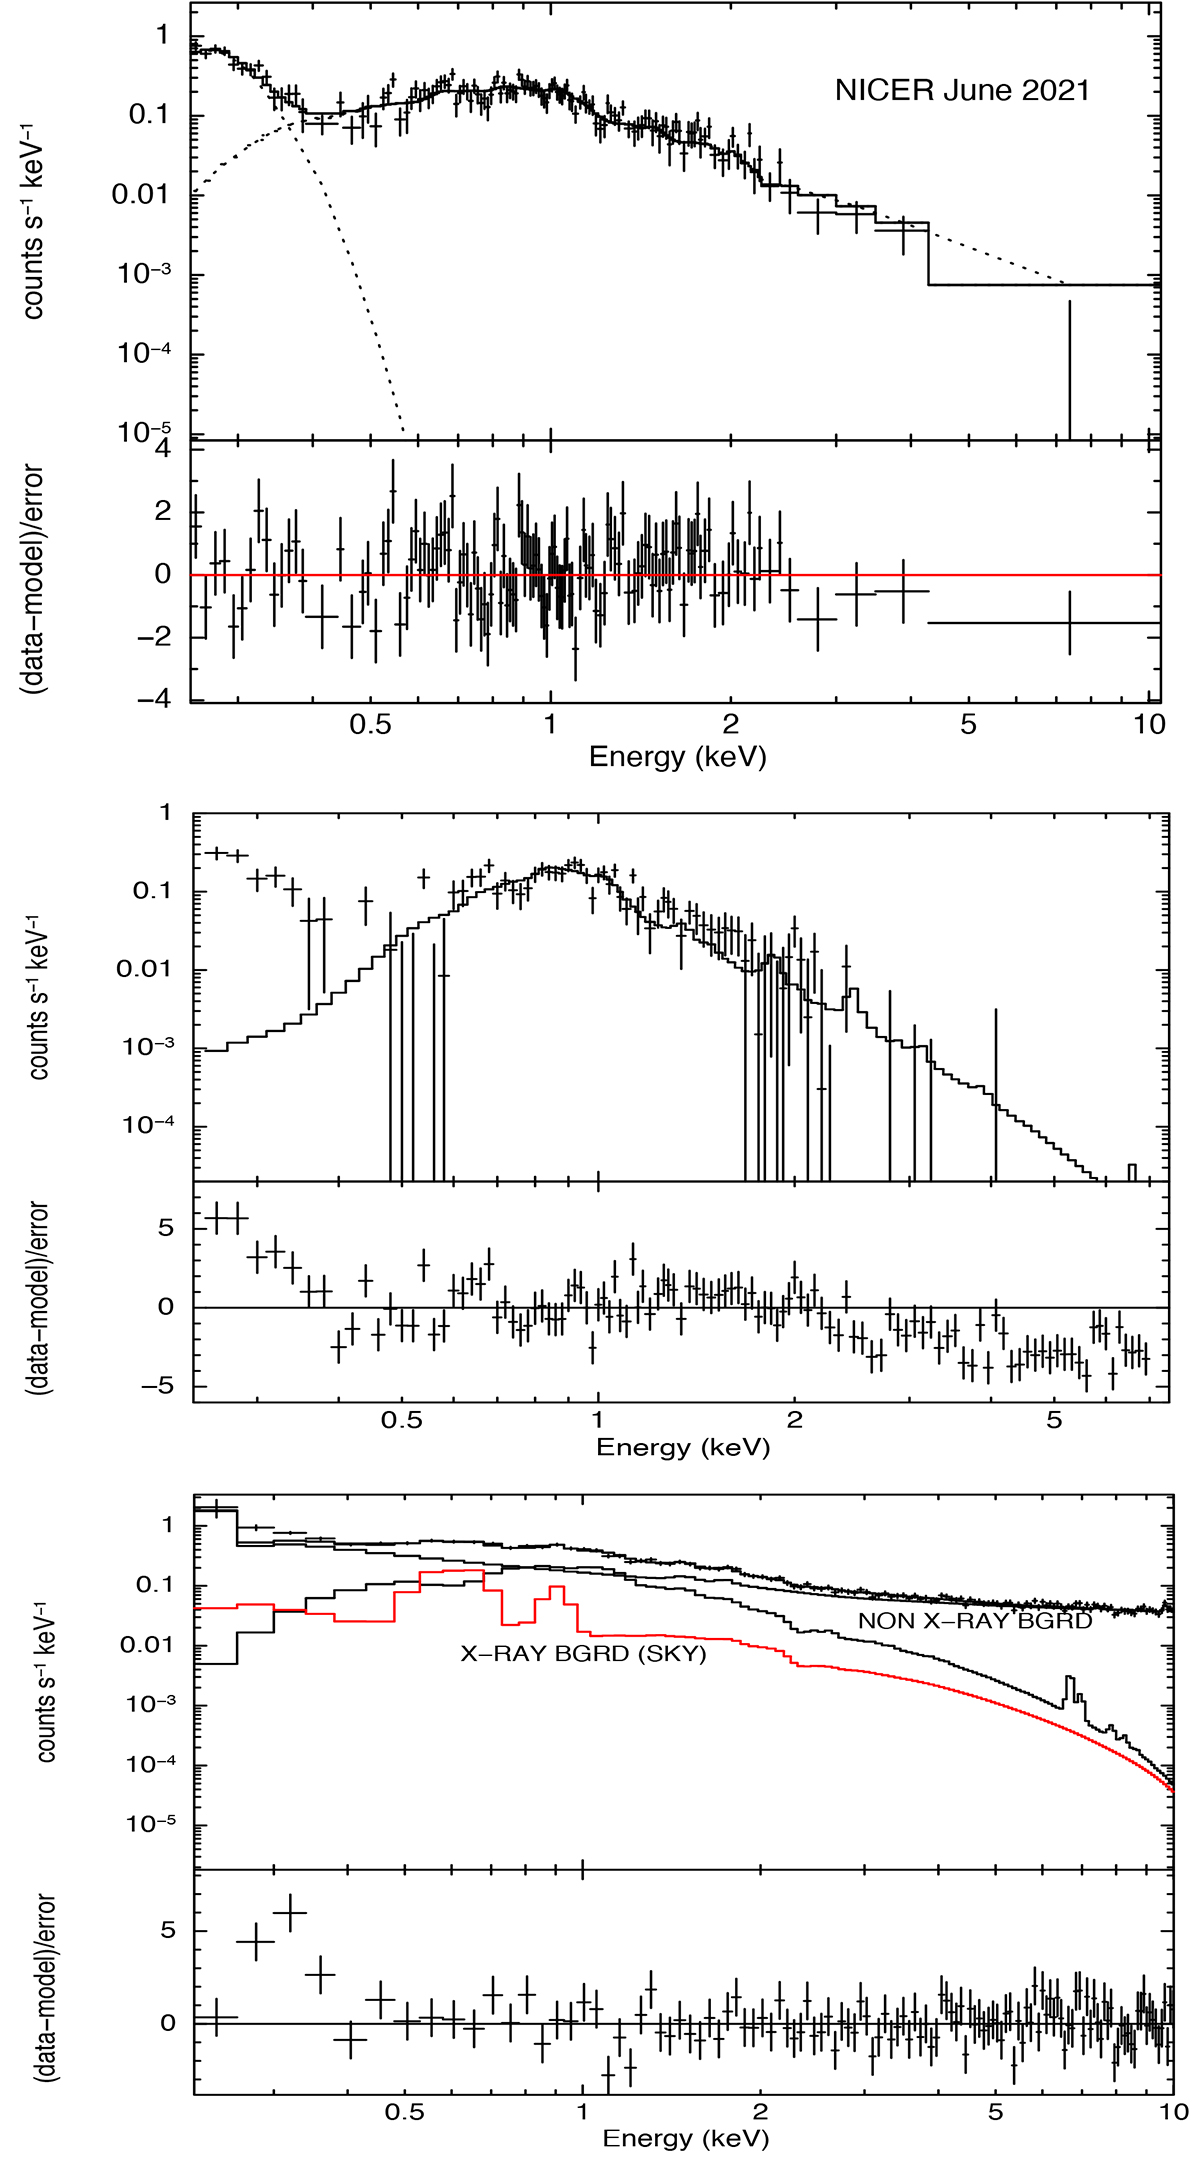
NICER spectrum and spectral fits. Top panel shows X-ray spectrum of SRGA J213151.5+491400 obtained with NICER between 0.25−10.0 keV (using 3C50 background model). The spectrum is fit with TBABS × (BBODY+CEVMKL) labeled with dotted lines and the residuals in the lower part are in standard deviations for all panels. The middle panel shows a spectrum derived using a very stringent undershoot parameter range of 0−50 to clear the dominant soft X-ray noise peak below 0.5 keV, which is fit with only a CEVMKL model using the 3C50 background model. The bottom panel shows the same spectrum created using the SCORPEON background model with different variable background contributions, fit without the blackbody component (see text for details).
Current usage metrics show cumulative count of Article Views (full-text article views including HTML views, PDF and ePub downloads, according to the available data) and Abstracts Views on Vision4Press platform.
Data correspond to usage on the plateform after 2015. The current usage metrics is available 48-96 hours after online publication and is updated daily on week days.
Initial download of the metrics may take a while.