Open Access
Fig. 11.
Download original image
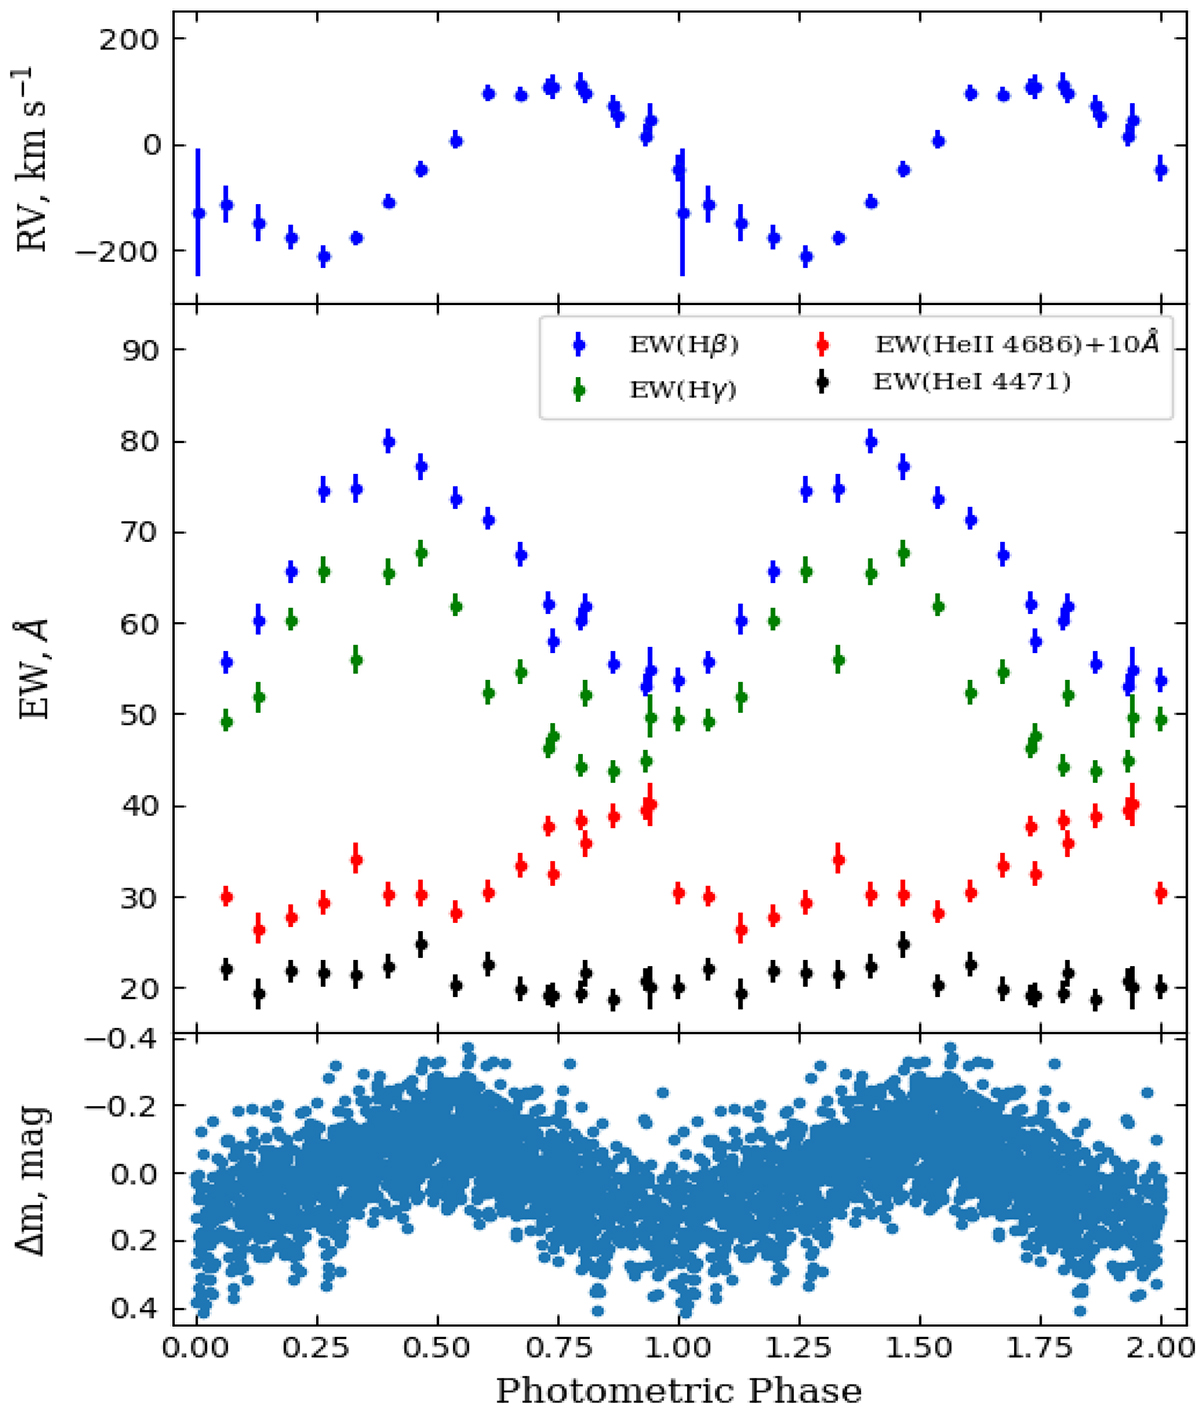
Radial velocity curve (upper panel), equivalent width curves of four emission lines (middle panel), and photometric light curve (lower panel) of SRGA J213151.5+491400. All curves were phased according to Ephemerides (Eq. (1)).
Current usage metrics show cumulative count of Article Views (full-text article views including HTML views, PDF and ePub downloads, according to the available data) and Abstracts Views on Vision4Press platform.
Data correspond to usage on the plateform after 2015. The current usage metrics is available 48-96 hours after online publication and is updated daily on week days.
Initial download of the metrics may take a while.