Open Access
Fig. 7
Download original image
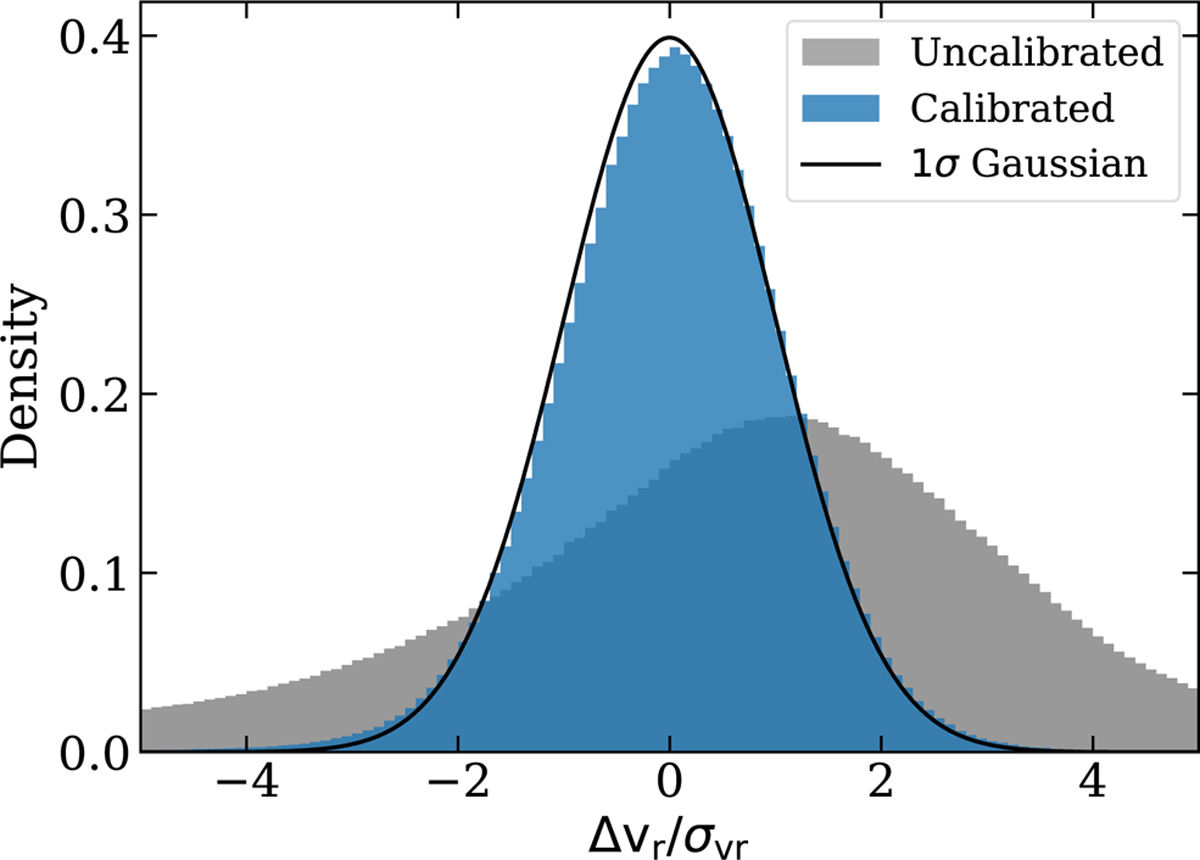
Difference in radial velocity over the uncertainty of both our calibrated and uncalibrated results compared to reference measurements. The solid line is a Gaussian distribution with a standard deviation of 1. The sample used to make this figure has calibrated radial velocity uncertainties of <300 km s−1.
Current usage metrics show cumulative count of Article Views (full-text article views including HTML views, PDF and ePub downloads, according to the available data) and Abstracts Views on Vision4Press platform.
Data correspond to usage on the plateform after 2015. The current usage metrics is available 48-96 hours after online publication and is updated daily on week days.
Initial download of the metrics may take a while.