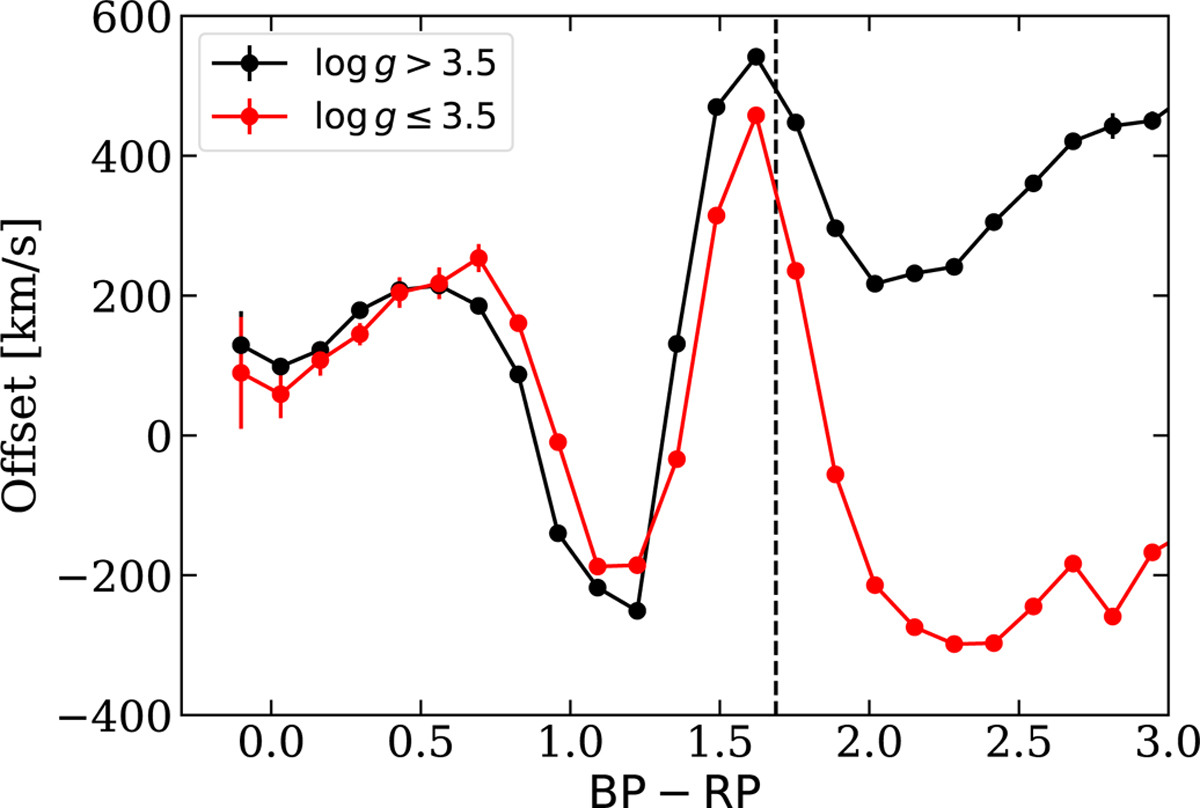
Fig. B.1

Download original image
Offset between the uncalibrated Gaia XP radial velocities and reference ones as a function of BP − RP colour. We split the dwarfs and the giants using the log g measurements from Zhang et al. (2023). The dashed vertical line shows the limit above which we used two bins in log g for our calibration model. The figure only includes sources with E(B−V) < 0.1 and 12 < G < 13.
Current usage metrics show cumulative count of Article Views (full-text article views including HTML views, PDF and ePub downloads, according to the available data) and Abstracts Views on Vision4Press platform.
Data correspond to usage on the plateform after 2015. The current usage metrics is available 48-96 hours after online publication and is updated daily on week days.
Initial download of the metrics may take a while.


