Fig. 1
Download original image
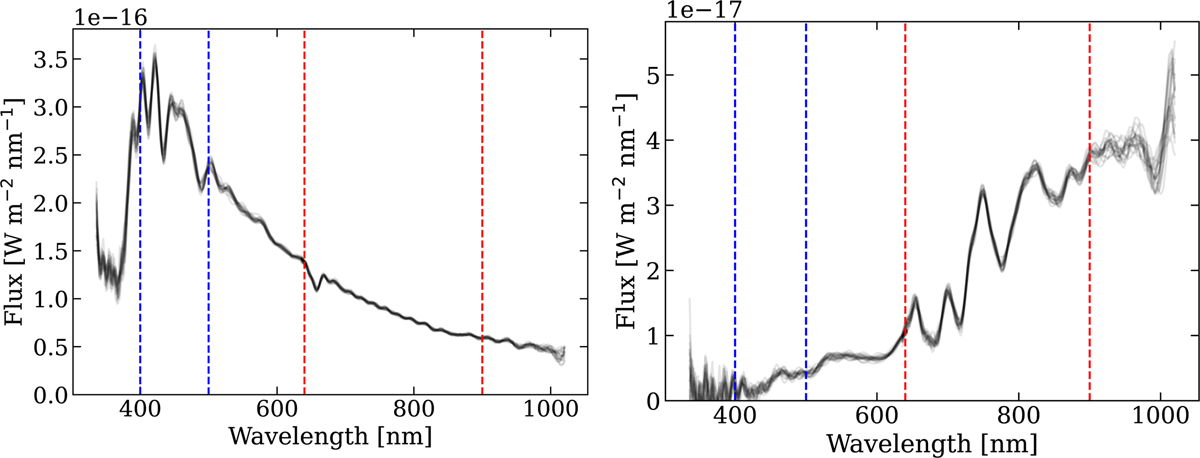
Example of two sampled Gaίa XP spectra, in black. The uncertainties in the spectral coefficients are sampled over to indicate the uncertainties in the sampled spectra. The dashed blue and red lines indicate the BP and RP spectral ranges used in the fitting procedure, respectively. On the left we show a hot star, Gaίa DR3 source_id 191594196746880, that displays prominent Balmer features. On the right we show a red source, Gaίa DR3 source_id 31958852451968, that contains broad molecular absorption bands.
Current usage metrics show cumulative count of Article Views (full-text article views including HTML views, PDF and ePub downloads, according to the available data) and Abstracts Views on Vision4Press platform.
Data correspond to usage on the plateform after 2015. The current usage metrics is available 48-96 hours after online publication and is updated daily on week days.
Initial download of the metrics may take a while.