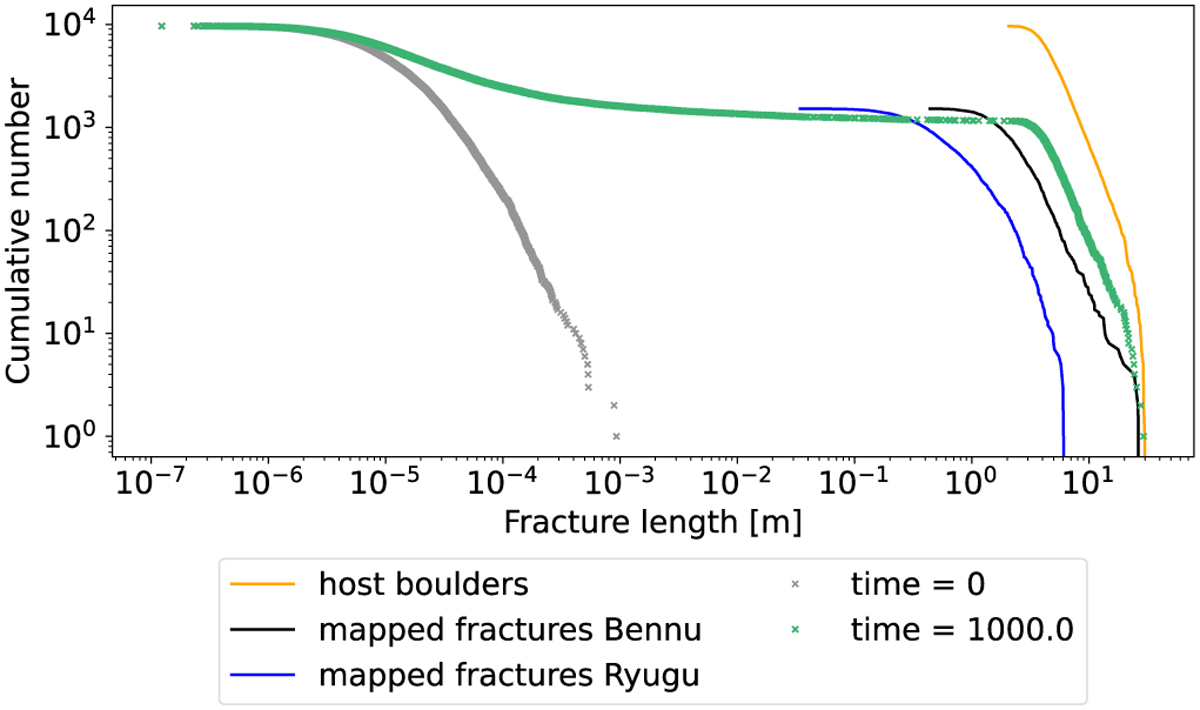
Fig. 9
Download original image
Modeling of the evolution of a length distribution of fractures. Here, Ryugu is modeled, with the model parameters from Table 2. The modeled green curve reaches the observed fracture length values after about 1000 yr. This does not seem plausible, because all boulders should then be entirely fractured, which is not supported by observations. This mismatch can be explained by the choice of modeling parameters that appear to be unsuitable for this model (see Sect. 4.3 and Appendix A). The gray curve is the initial random distribution of microscopic fractures at time 0. The green curve is the modeled fracture distribution after 1000 yr. The blue and black curves are the mapped fracture distributions of Ryugu and Bennu, respectively. The yellow curve represents the maximum possible value, that is, the diameter distribution of boulders on Ryugu. Dotted values are modeled. The modeled values and the yellow host boulder distribution are now larger, since the boulder data from Michikami et al. (2019) is used, with more boulders found on Ryugu than on Bennu.
Current usage metrics show cumulative count of Article Views (full-text article views including HTML views, PDF and ePub downloads, according to the available data) and Abstracts Views on Vision4Press platform.
Data correspond to usage on the plateform after 2015. The current usage metrics is available 48-96 hours after online publication and is updated daily on week days.
Initial download of the metrics may take a while.