Fig. 8
Download original image
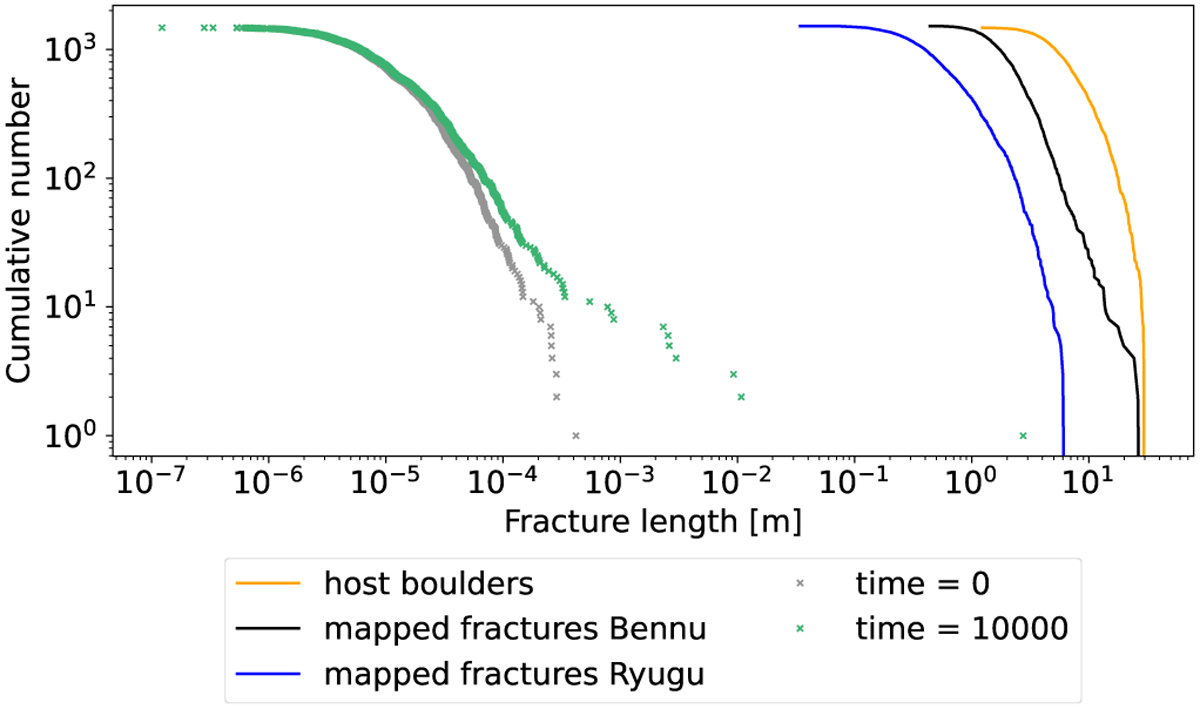
Modeling of the evolution of a length distribution of fractures. Here, Bennu is modeled, exactly as in Delbo et al. (2022). The parameters used are listed in Table 2. The gray curve is the initial random distribution of microscopic fractures at time 0. The green curve is the modeled fracture distribution after 10 000 yr. The blue and black curves are the mapped fracture distributions of Ryugu and Bennu, respectively. The yellow curve represents the maximum possible value, that is, the diameter distribution of boulders on Bennu. Modeled values are dotted.
Current usage metrics show cumulative count of Article Views (full-text article views including HTML views, PDF and ePub downloads, according to the available data) and Abstracts Views on Vision4Press platform.
Data correspond to usage on the plateform after 2015. The current usage metrics is available 48-96 hours after online publication and is updated daily on week days.
Initial download of the metrics may take a while.