Fig. 7
Download original image
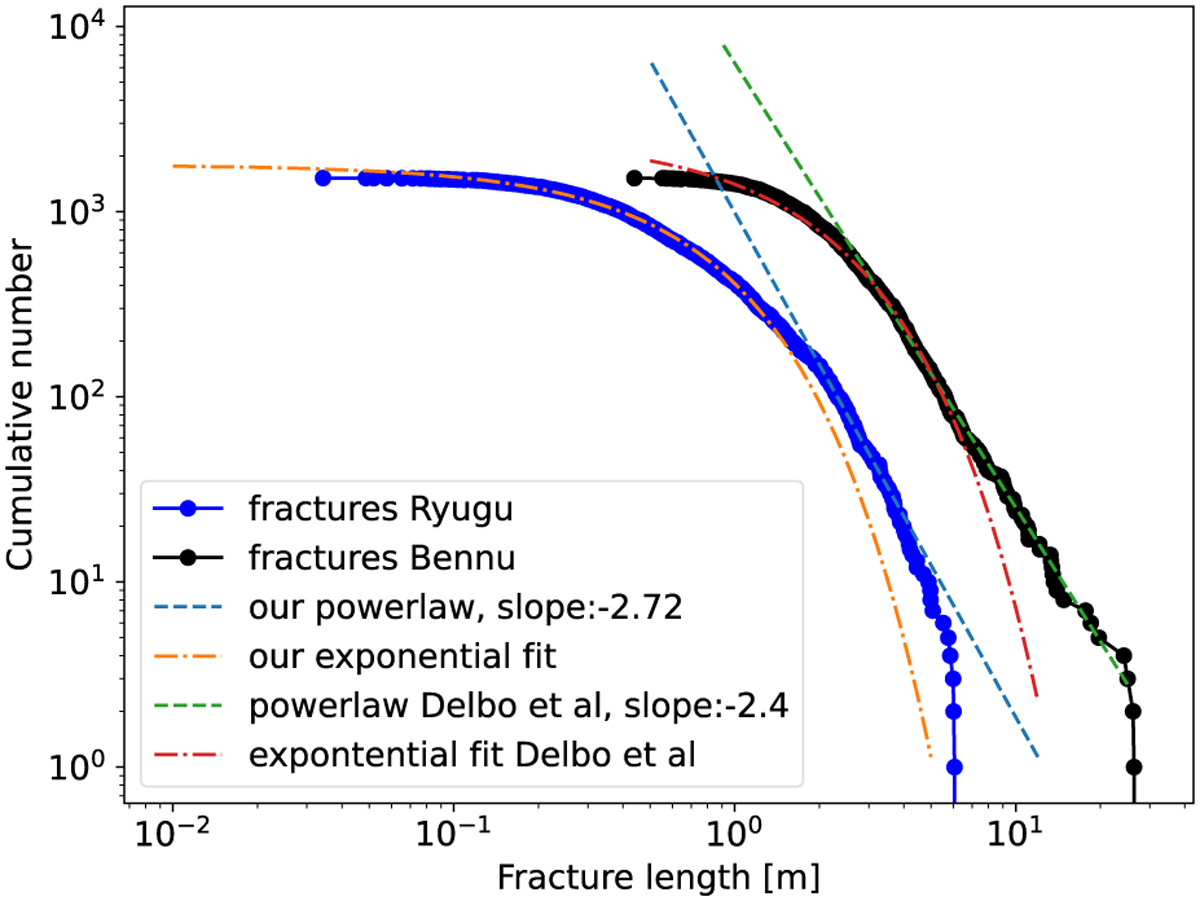
Cumulative distribution of the length of fractures and fracture segments. The gray and black curves are from Delbo et al. (2022) and the blue curves are from this work on Ryugu. The dashed yellow and blue lines are power laws, fitted to the larger part of the plot. The dash-dotted red and green lines are exponential laws, fitted to the smaller part of the curves.
Current usage metrics show cumulative count of Article Views (full-text article views including HTML views, PDF and ePub downloads, according to the available data) and Abstracts Views on Vision4Press platform.
Data correspond to usage on the plateform after 2015. The current usage metrics is available 48-96 hours after online publication and is updated daily on week days.
Initial download of the metrics may take a while.