Fig. 2
Download original image
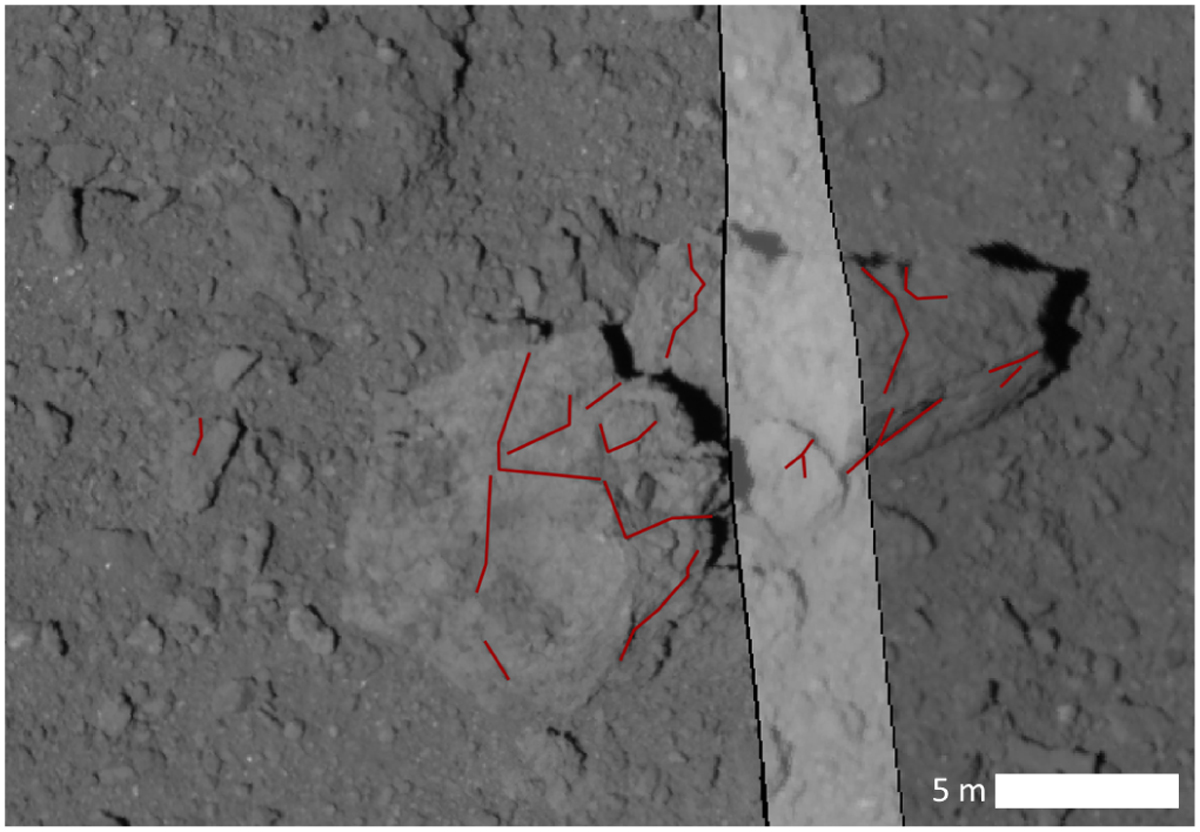
Mapping example, with fracture segments in red. Composition of three Hayabusa2 images: hyb2_onc_20180921_025306_tvf_l2d, hyb2_onc_20181015_140115_tvf_l2d, and hyb2_onc_20181015_140218_tuf_l2d. The largesttwo boulders shown in this image are likely a fragmented boulder that was split in two along a fracture between the boulders (not mapped). The presence of two large boulders at such a close distance is most easily explained by them belonging to a single block (Ruesch et al. 2020; Rüsch & Bickel 2023).
Current usage metrics show cumulative count of Article Views (full-text article views including HTML views, PDF and ePub downloads, according to the available data) and Abstracts Views on Vision4Press platform.
Data correspond to usage on the plateform after 2015. The current usage metrics is available 48-96 hours after online publication and is updated daily on week days.
Initial download of the metrics may take a while.