Fig. 1
Download original image
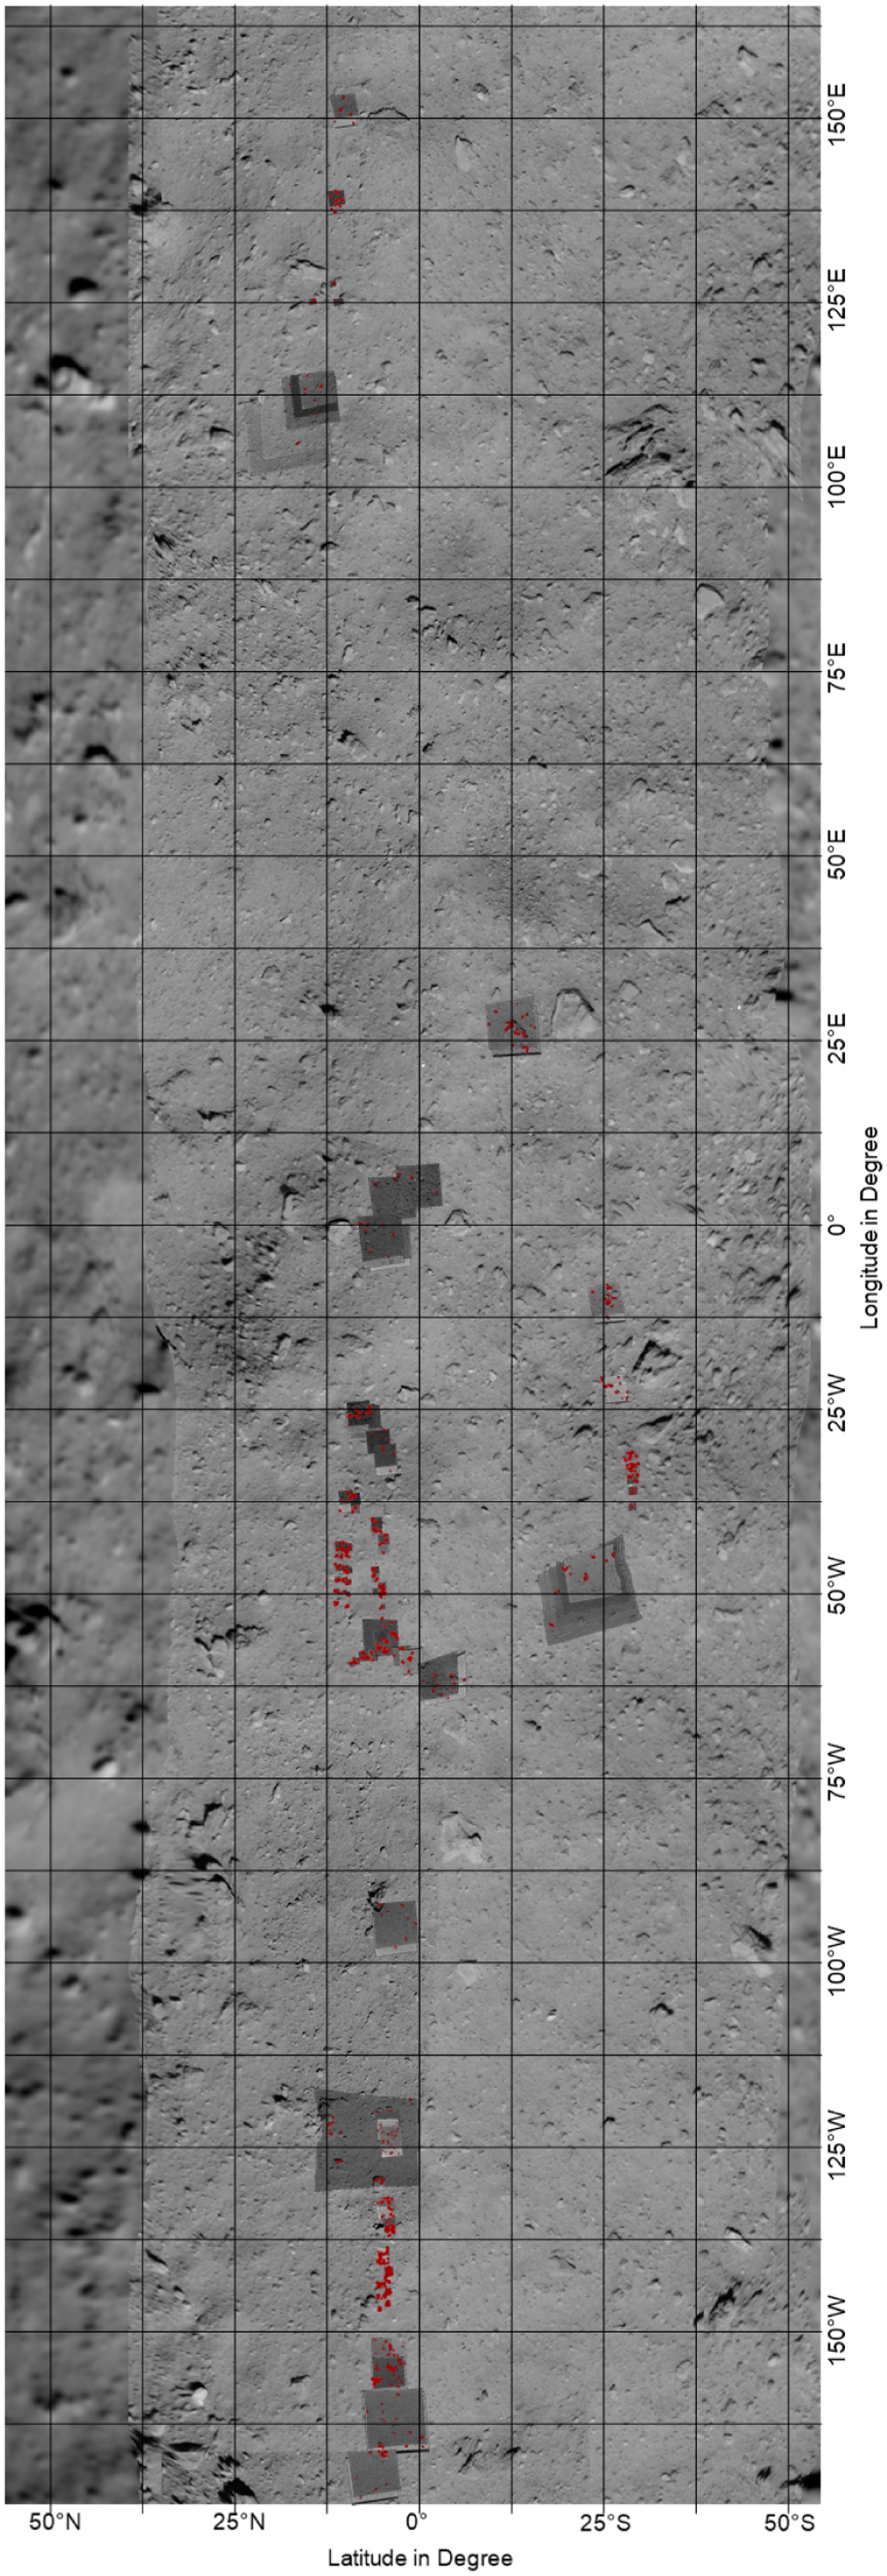
Map of Ryugu between 50° north and 50° south. Red markings are fractures, mapped on available high-resolution images. This image is a compilation of a global Ryugu mosaic and the high-resolution images we worked on. For more information, see Sects. 1 and 2. The names of the individual images are listed in Appendix C. It is rotated for better visibility, so north is to the left and east is to the top.
Current usage metrics show cumulative count of Article Views (full-text article views including HTML views, PDF and ePub downloads, according to the available data) and Abstracts Views on Vision4Press platform.
Data correspond to usage on the plateform after 2015. The current usage metrics is available 48-96 hours after online publication and is updated daily on week days.
Initial download of the metrics may take a while.