Fig. 8
Download original image
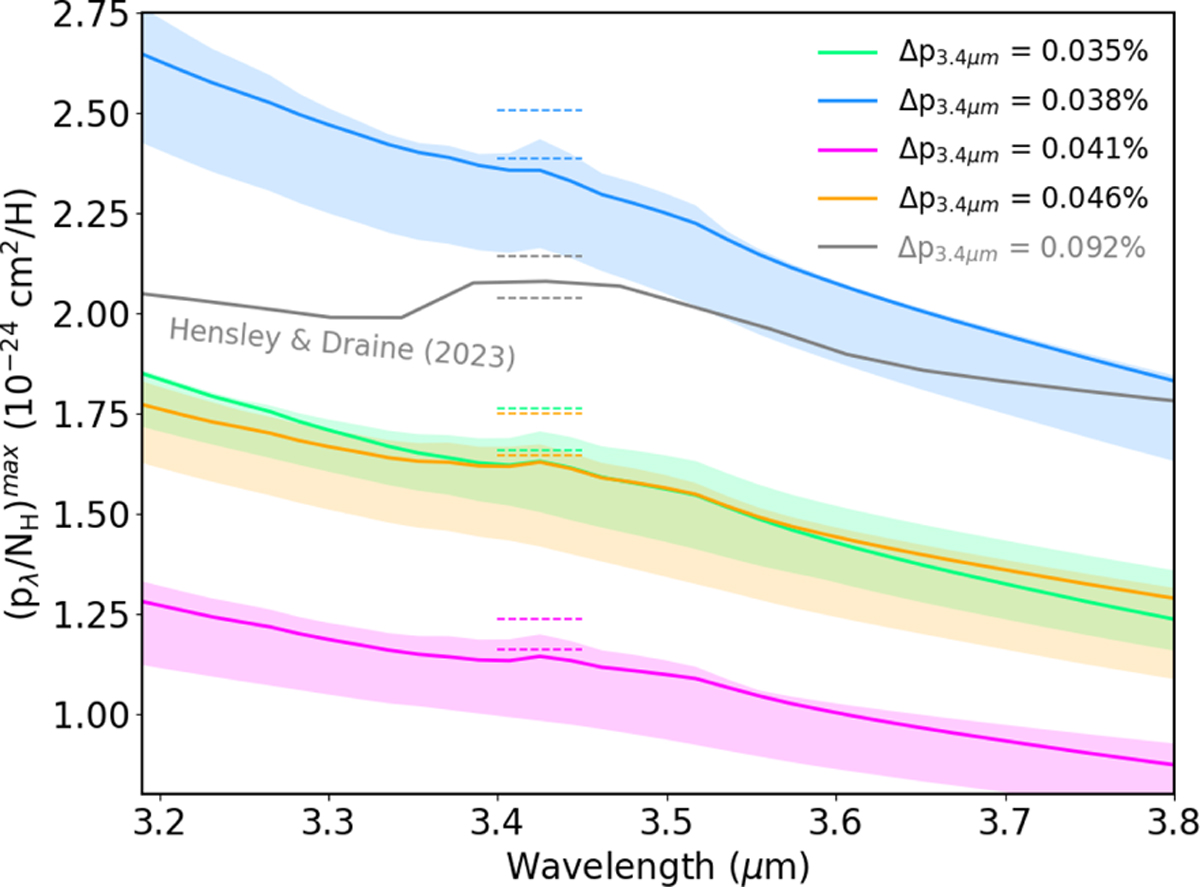
Same colour scheme as in Fig. 7. Zoom on the 3.4 µm hydrocarbon feature seen in polarised extinction. The dashed lines show the upper limits measured by Chiar & Tielens (2006) towards GCS 3-II and GCS 3-IV, lowest and highest lines, respectively, above the continuum of our four best-fit models (see Sect. 6.3 for details). For comparison, we also show in grey the model of Hensley & Draine (2023) which complies with the upper limit measured towards GCS 3-IV but not with the lower one towards GCS 3-II. Hensley & Draine (2023) gives indeed ∆p3.4 µm 2 to 2.6 times as large as our best models.
Current usage metrics show cumulative count of Article Views (full-text article views including HTML views, PDF and ePub downloads, according to the available data) and Abstracts Views on Vision4Press platform.
Data correspond to usage on the plateform after 2015. The current usage metrics is available 48-96 hours after online publication and is updated daily on week days.
Initial download of the metrics may take a while.