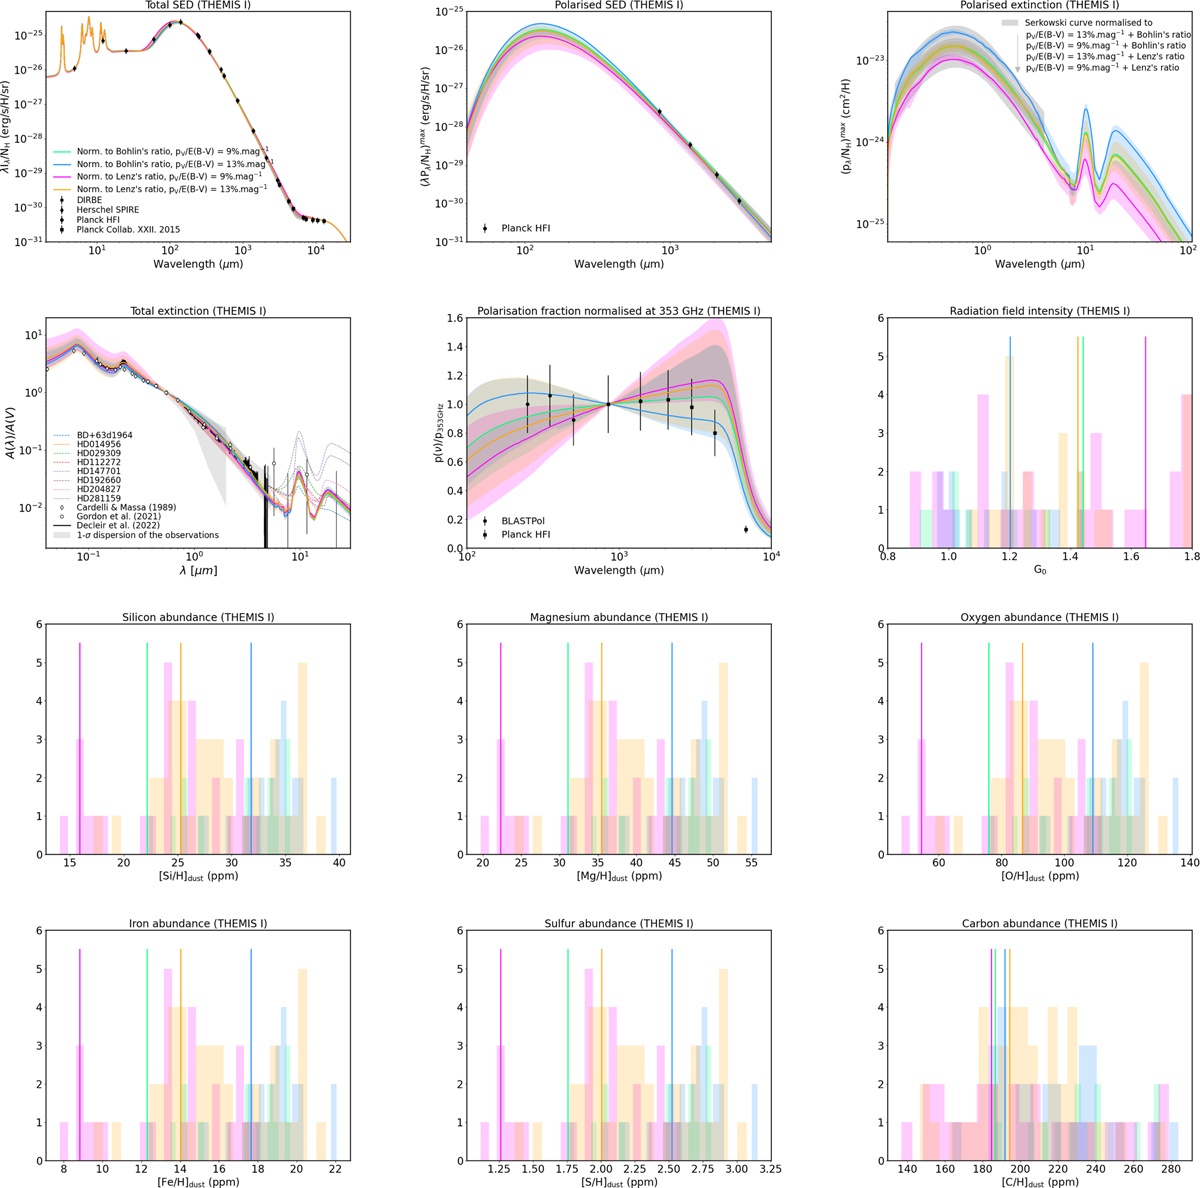
Fig. C.4
Download original image
Same as Fig. 7 but for fits performed with THEMIS I silicates (see Table 1). The data are those presented in Sect. 5. From top to bottom and left to right, the figures first show the models against the observations: total SED, polarised SED, polarised extinction, total extinction; and then some model parameters: radiation field, silicium abundance, magnesium abundance, oxygen abundance, iron abundance, sulphur abundance, and carbon abundance. The light coloured areas represent the dispersion of the models in agrement with the observations and the matching thick solid lines show the best fits. As detailed in the text, two gas-to-dust mass ratios and two maximum optical polarisation values are considered to normalise the models. The models normalised to the ratio of Lenz et al. (2017) are shown in magenta and orange for pV/E(B − V) = 9% and 13%, respectively. Those normalised to the ratio of Bohlin et al. (1978) are shown in green and blue for pV/E(B − V) = 9% and 13%, respectively.
Current usage metrics show cumulative count of Article Views (full-text article views including HTML views, PDF and ePub downloads, according to the available data) and Abstracts Views on Vision4Press platform.
Data correspond to usage on the plateform after 2015. The current usage metrics is available 48-96 hours after online publication and is updated daily on week days.
Initial download of the metrics may take a while.