Fig. 12
Download original image
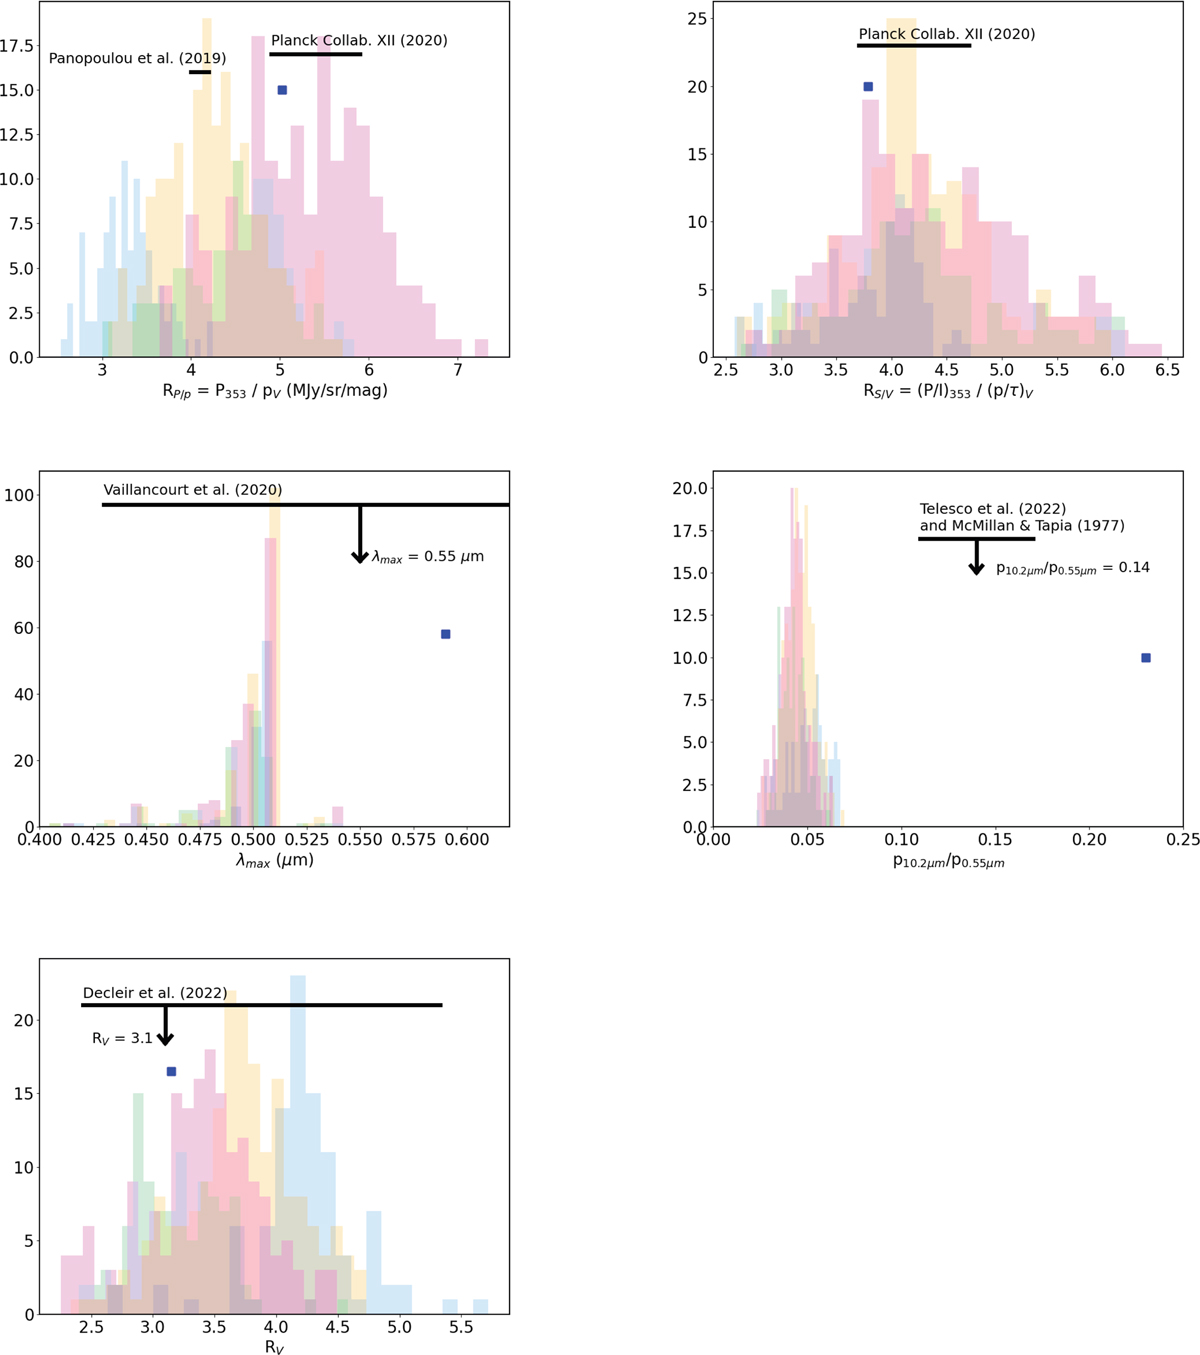
Histograms of parameters derived from our best fits represented with the same colour scheme as in Fig. 7. For comparison, the parameters derived from the model of Hensley & Draine (2023) are shown by the dark blue squares. The two figures in the top row show two characteristic ratios of the polarised observations made with the Planck satellite: RP/p and RS/V. The measurements, including their uncertainties, made by Panopoulou et al. (2019) and Planck Collaboration XII (2020), are represented by the black horizontal lines. The two figures in the middle row show the dispersion of λmax (left) and of the polarised extinction at 10 µm normalised to the optical (right) of our best fits. The measurements, including their uncertainties, made by Vaillancourt et al. (2020) and Telesco et al. (2022) combined to McMillan & Tapia (1977) are shown by the black horizontal lines. The bottom row figure shows the histogram of the extinction parameter RV. The measurements made by Decleir et al. (2022), including their uncertainties, are shown by the black horizontal line.
Current usage metrics show cumulative count of Article Views (full-text article views including HTML views, PDF and ePub downloads, according to the available data) and Abstracts Views on Vision4Press platform.
Data correspond to usage on the plateform after 2015. The current usage metrics is available 48-96 hours after online publication and is updated daily on week days.
Initial download of the metrics may take a while.