Fig. 11
Download original image
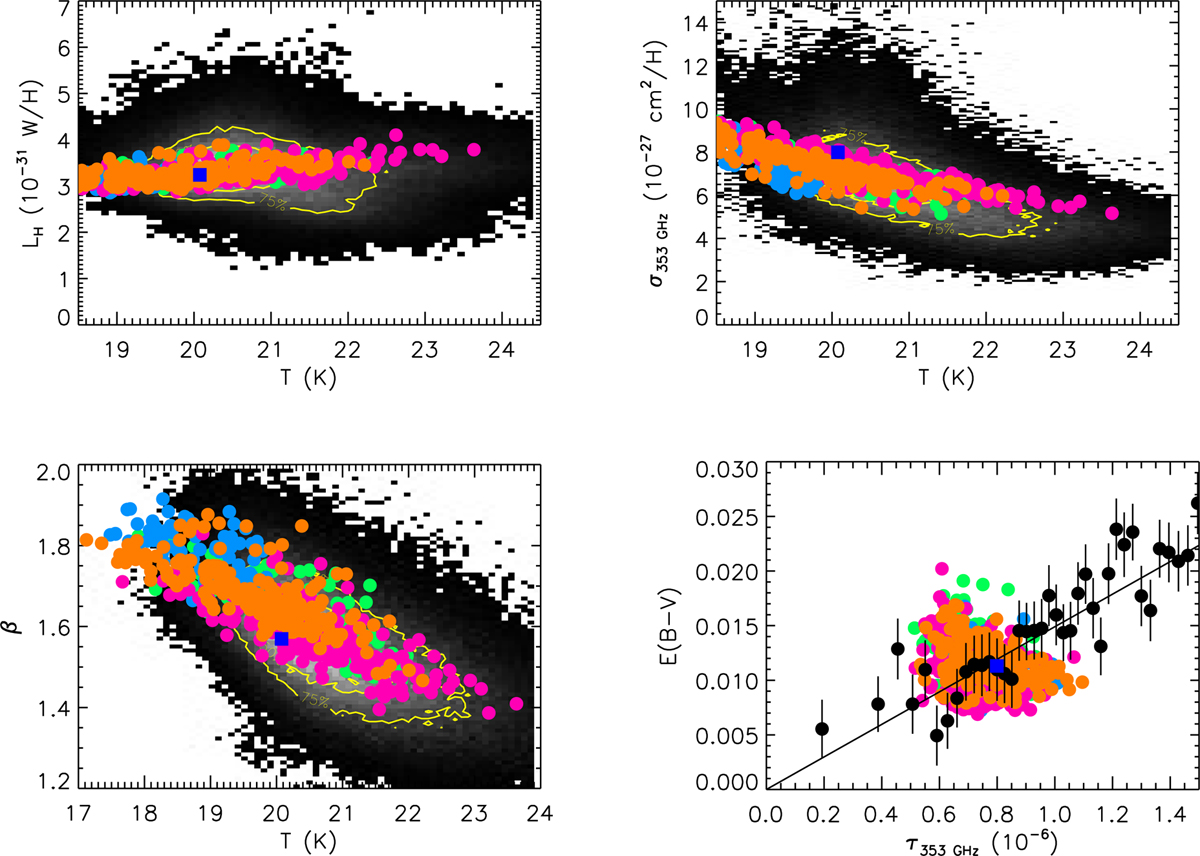
Variations in the dust parameters presented by Planck Collaboration XI (2014), based on a pixel-by-pixel modified blackbody χ2 fit (see Eq. (7) and Sect. 6.4 for details). In the top left and right, and the bottom left figures, the observational results are the density of points maps, on which we overplot yellow contours: the central contour encloses 50% of the observed pixels and the external contour 75%. In the bottom right figure, the observational results are the black dots with error bars. In the four figures, the model results are the coloured dots, with the same colour scheme as in Fig. 7. Models normalised to the ratio of Lenz et al. (2017) are shown by magenta and orange dots for pV/E(B − V) = 9% and 13%, respectively. Those normalised to the ratio of Bohlin et al. (1978) are shown by green and blue dots for pV/E(B − V) = 9% and 13%, respectively. For comparison, the dark blue squares show the parameters derived from the model of Hensley & Draine (2023). Top left: luminosity vs. temperature. Top right: opacity at 353 GHz vs. temperature. Bottom left: spectral index vs. temperature. Bottom right: E(B-V) vs. optical depth at 353 GHz, models shown for NH = 1020 H cm−2.
Current usage metrics show cumulative count of Article Views (full-text article views including HTML views, PDF and ePub downloads, according to the available data) and Abstracts Views on Vision4Press platform.
Data correspond to usage on the plateform after 2015. The current usage metrics is available 48-96 hours after online publication and is updated daily on week days.
Initial download of the metrics may take a while.