Fig. 10
Download original image
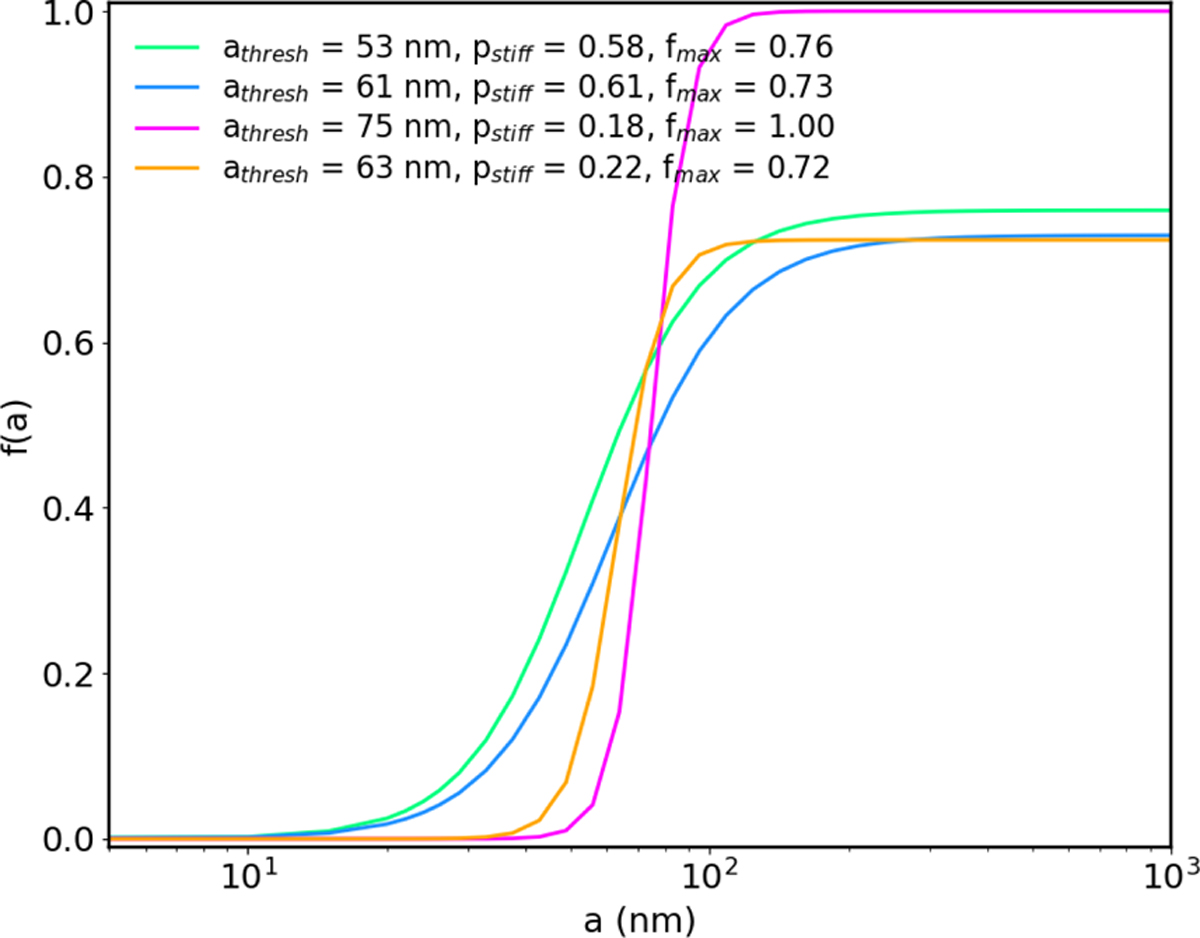
Alignment functions of the best fits presented in Fig. 7 and Sect. 6.3. The colour scheme is the same as in Fig. 7. Models normalised to the ratio of Lenz et al. (2017) are shown by magenta and orange lines for pV/E(B − V) = 9% and 13%, respectively. Both models are for pro-lates with e = 2. Those normalised to the ratio of Bohlin et al. (1978) are shown by green and blue lines for pV/E(B − V) = 9% and 13%, respectively. The model plotted in green is for oblates with e = 1.3 and the one in blue for prolates with e = 2.
Current usage metrics show cumulative count of Article Views (full-text article views including HTML views, PDF and ePub downloads, according to the available data) and Abstracts Views on Vision4Press platform.
Data correspond to usage on the plateform after 2015. The current usage metrics is available 48-96 hours after online publication and is updated daily on week days.
Initial download of the metrics may take a while.