Fig. 1
Download original image
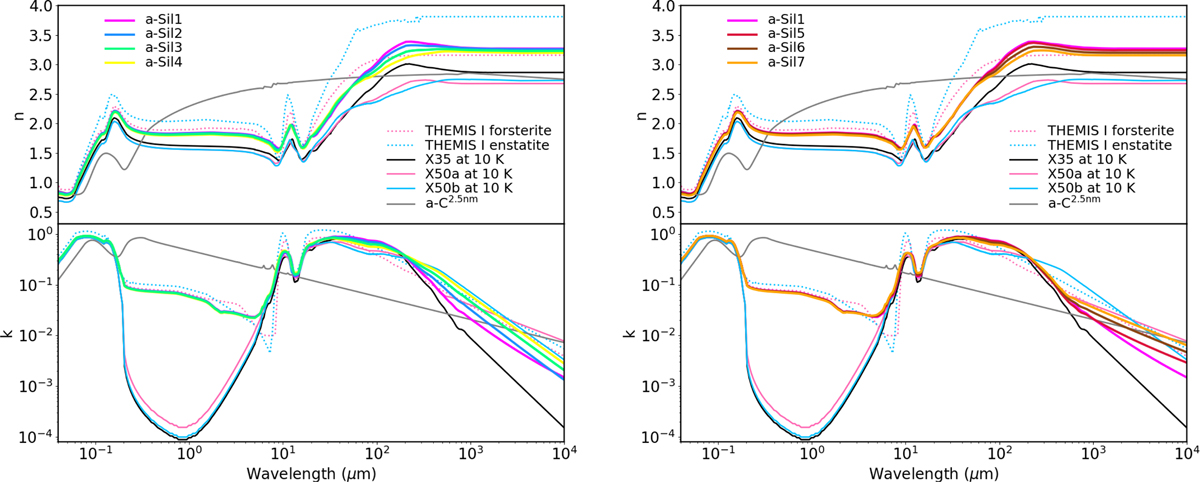
Complex refractive indices, m = n + ik, of the silicate materials. Top: real part. Bottom: imaginary part. Left: complex refractive indices for the calculation of the silicate grain optical properties. Demyk et al. (2017) silicate samples measured at 10 K are shown: forsterite X35 sample (black), enstatite X50a sample (light pink), enstatite X50b sample (light blue) along with the aSil-1, aSil-2, aSil-3, and aSil-4 mixtures as pink, blue, green, and yellow thick lines, respectively (see Sect. 2.1.2 and Table 1 for details). We note that 10% of the silicate volume is occupied by metallic nano-inclusions of Fe and FeS (70% and 30% of the total volume of the inclusions, respectively), hence the increase in the visible to mid-IR imaginary part of the refractive index. For comparison, the optical constants of the two silicate materials used in the original THEMIS are shown with dotted lines. The optical constants used for the 5 nm-thick aromatic-rich carbon mantles, a-C2.5nm, are also plotted (grey, see Sect. 2.2 for details). Right: same for the aSil-5, a-Sil-6, and aSil-7 mixtures as red, brown, and orange thick lines, respectively.
Current usage metrics show cumulative count of Article Views (full-text article views including HTML views, PDF and ePub downloads, according to the available data) and Abstracts Views on Vision4Press platform.
Data correspond to usage on the plateform after 2015. The current usage metrics is available 48-96 hours after online publication and is updated daily on week days.
Initial download of the metrics may take a while.