Open Access
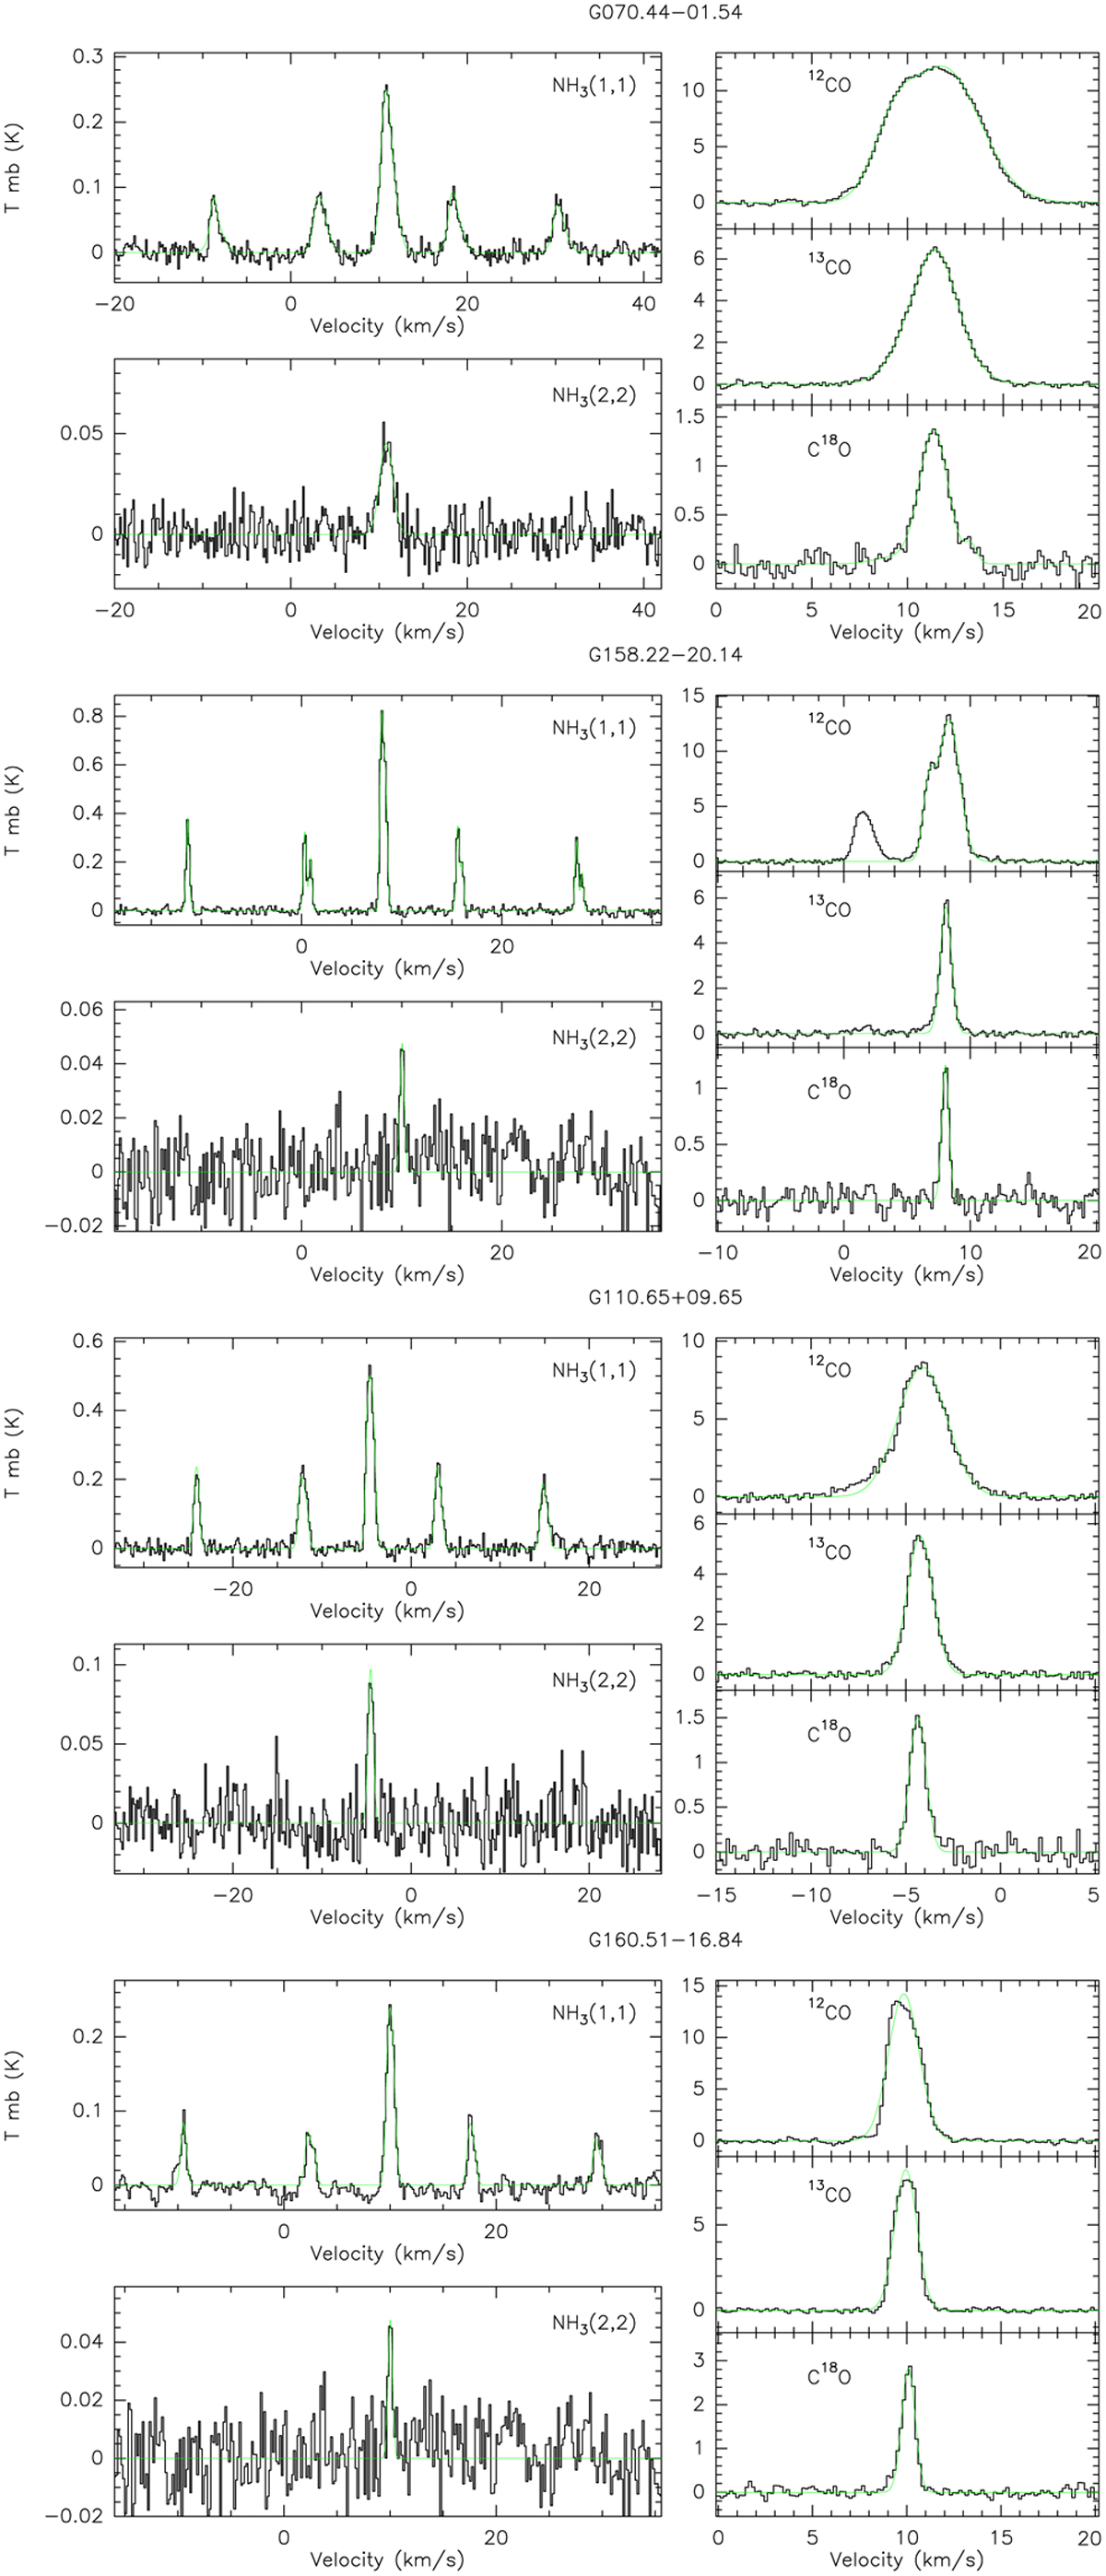
Fig. B.1
Download original image
Examples for typical ammonia spectra in different S/N. Spectra include NH3 (1,1) and (2,2), 12CO, 13CO and C18O (1-0) transitions toward cores, namely G070.44-01.54, G110.65+09.65, G158.22-20.14, and G160.51-16.84. The green color indicates the NH3 (1,1) fitting and Gauss fitting of NH3 (2,2), 12CO, 13CO and C18O profile.
Current usage metrics show cumulative count of Article Views (full-text article views including HTML views, PDF and ePub downloads, according to the available data) and Abstracts Views on Vision4Press platform.
Data correspond to usage on the plateform after 2015. The current usage metrics is available 48-96 hours after online publication and is updated daily on week days.
Initial download of the metrics may take a while.