Fig. 1
Download original image
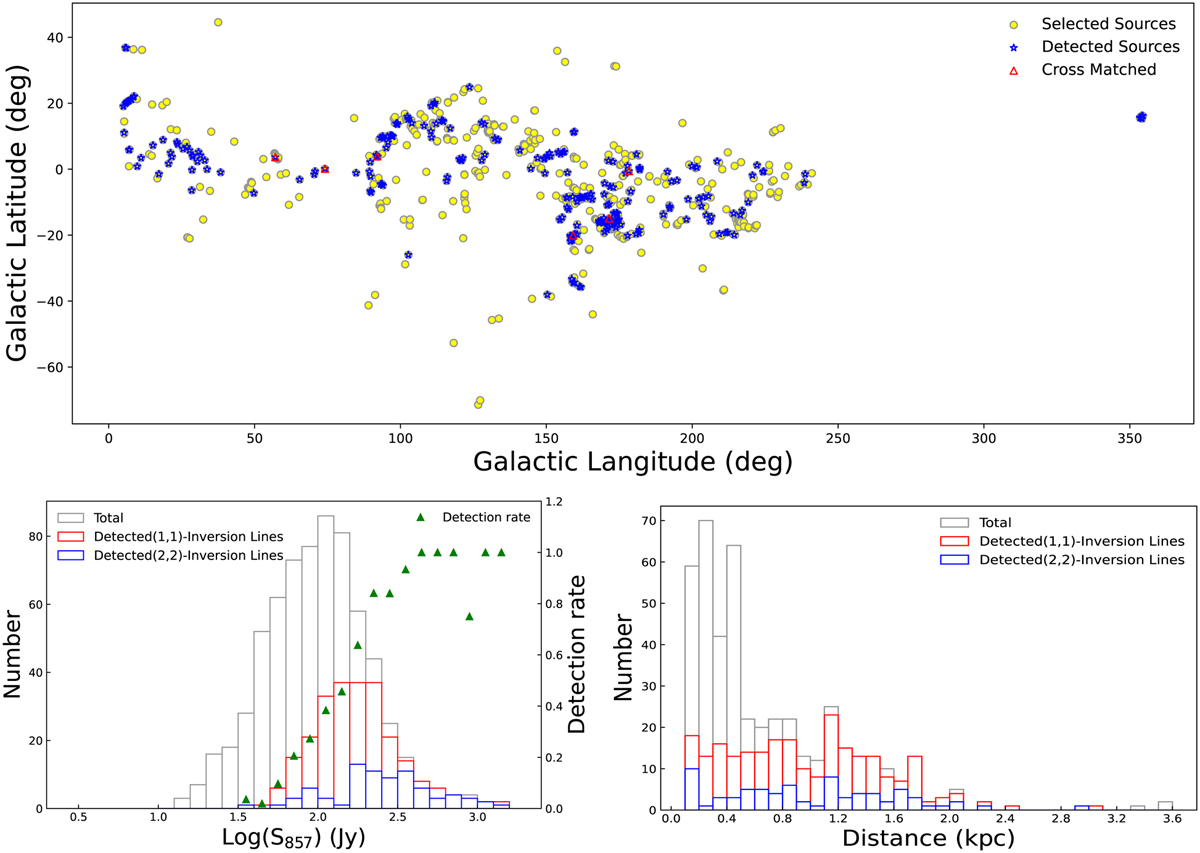
Multi aspect analysis of observed cores: distribution, emission line detection rates, and distance distribution. Top panel: distribution of observed cores in the Galactic plane. The selected cores with and without detections of NH3 emission lines are denoted by blue and yellow circles, respectively. The red triangles denote Planck sources not only being part of our sample but having also been previously detected in ammonia by Fehér et al. (2022). Lower left: detection rate distribution of NH3 emission lines. The grey histogram represents the whole sample of 672 sources where we searched for NH3 lines. The red histogram represents the number of sources that we detected in the NH3 (1,1) line and the blue histogram refers to sources we also detected in the NH3 (2,2) line. The green triangles denote the detection rate for a given 857 µm flux density. Lower right: distribution of distances. Here the grey histogram also refers to the entire sample, while the red histogram visualizes those sources detected in NH3 (1,1). The blue histogram refers to sources we also detected in the NH3 (2,2) line.
Current usage metrics show cumulative count of Article Views (full-text article views including HTML views, PDF and ePub downloads, according to the available data) and Abstracts Views on Vision4Press platform.
Data correspond to usage on the plateform after 2015. The current usage metrics is available 48-96 hours after online publication and is updated daily on week days.
Initial download of the metrics may take a while.